Google Shopping Analytics & Feed Management, In One Dashboard
Stop switching between Google Ads and Merchant Center. SKU Analyzer combines product performance analytics, feed management, search term reports, and competitive pricing intelligence — with custom label automation, title optimization, and Performance Max channel breakdown built in.
No signup required · Explore with sample data
I've managed 30+ Google Ads accounts and hundreds of Shopping campaigns.
Analyzing them has always been a nightmare.
Google Ads UI is broken for product performance analysis
- One summary table, one or two metrics, no context
- Splitting by brand, product type, custom labels? Possible in theory, but manual nightmare
- Finding what's working vs what's bleeding money? Good luck
Merchant Center data lives on a different planet
- Product feed data, competition pricing—incredibly useful but UI for analyzing sucks
- Completely disconnected from your Shopping Ads performance
- Combining Merchant Center data, like feed variables to shopping performance data is not possible
Existing tools don't solve this
- Most product-level tools on the market solve different problems and don't focus on analytics
- Channable, Producthero = feed management, not analytics
- Supermetrics = data pipelines, still need to build everything
So I built my own tool.

Samuli Kesseli
10+ years managing Google Ads accounts • Millions in ad spend across 30+ companies
Senior consultant by day, builder of things by night. I've worked with small startups, big corporations, and everything in between. Analyzed and managed too many Google Ads accounts to count. Realized that Shopping Ads campaigns are often where the real money flows in ecommerce accounts, and they're impossibly hard to analyze properly with existing tools. SKU Analyzer is my answer to that.
How it works
A simple 4-step process to get your dashboard up and running. No complex setup required.
Connect Your Google Account
Sign in securely with your Google account through Google's official OAuth. No passwords are stored—just a secure connection.
Choose Google Ads and Merchant Center Accounts To Connect
Select which Google Ads and Merchant Center accounts you want to analyze.
Data Sync
SKU Analyzer securely pulls your performance metrics, product data, and competitive insights from Google's APIs.
Dashboard Ready
Data is processed and stored securely in your account. Your dashboard displays insights immediately, with automatic daily refreshes to keep everything up-to-date.
You can revoke SKU Analyzer's access anytime from your Google Account Permissions page.
Everything You Need for Google Shopping
15 purpose-built tools combining Google Ads performance, Merchant Center data, competitive intelligence, and Meta Ads — updated daily.

Product Analytics
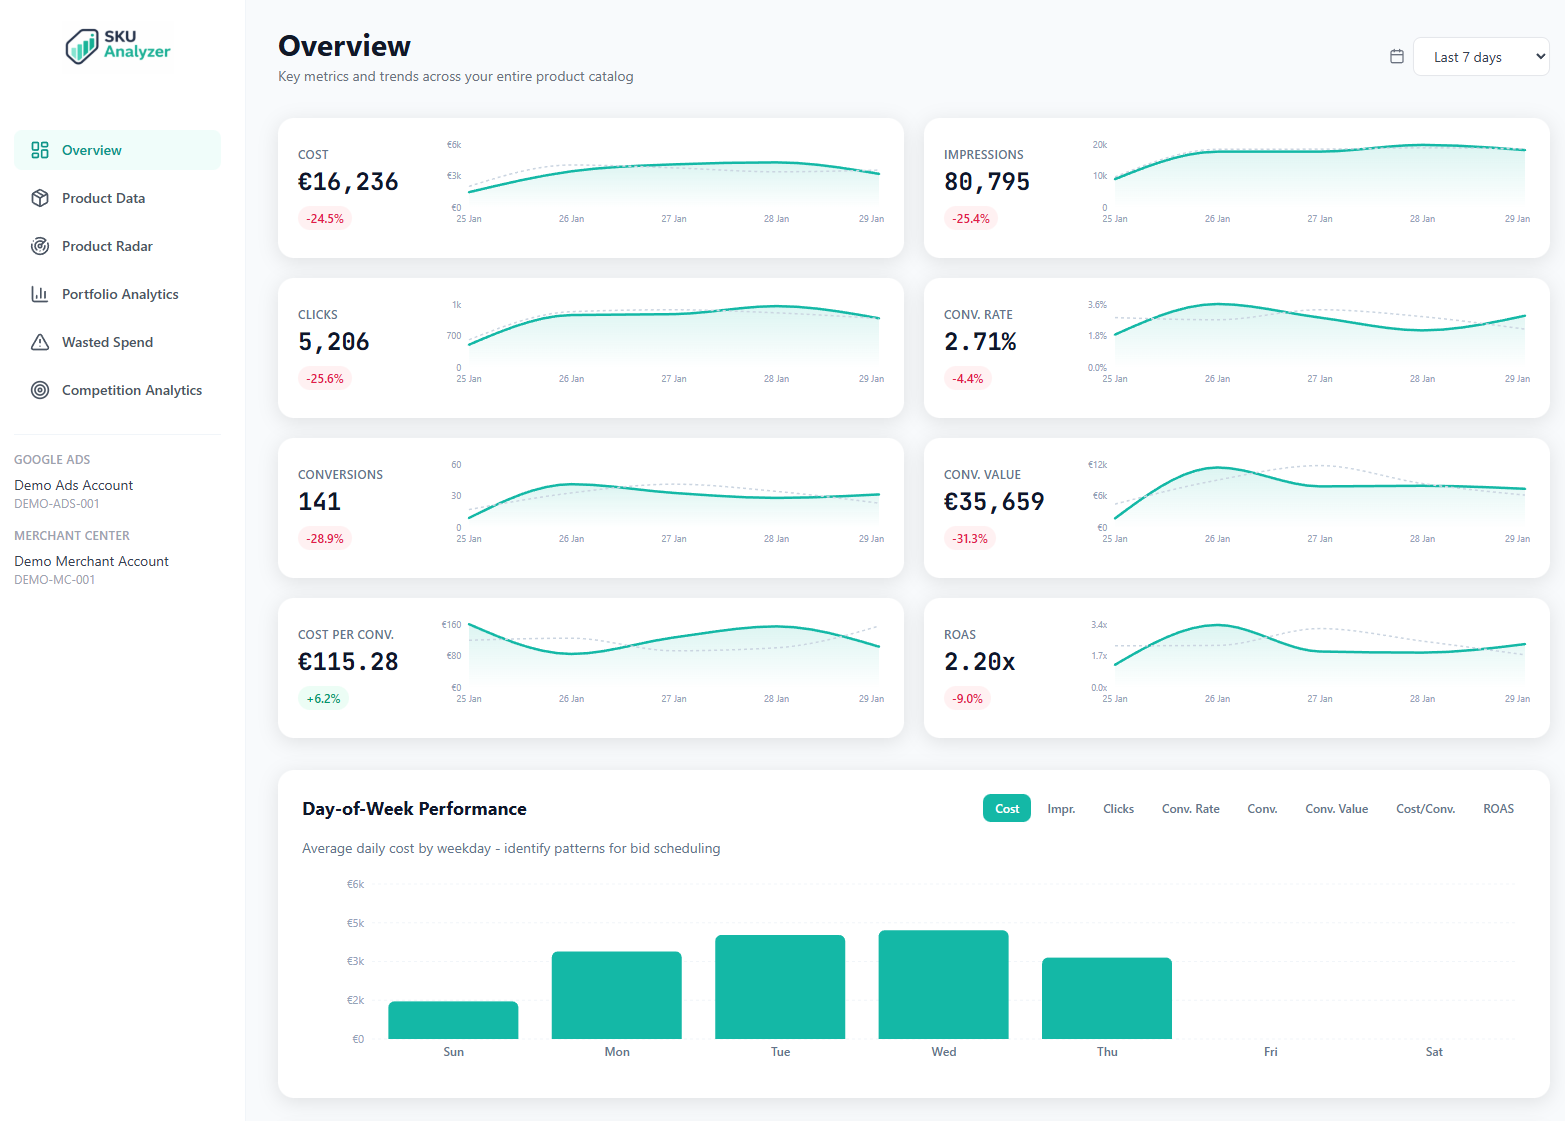
Overview Dashboard
KPIs with sparklines, brand breakdown, revenue concentration, day-of-week heatmap
Product Explorer
15+ metrics per product, inline sparklines, daily time series, impression share
Product Radar
Top 100 products on interactive scatter chart with product images as data points
Portfolio Analytics
Cross-filter by brand, product type, and all 5 custom labels with synchronized charts
Feed Management & Optimization
Campaign Intelligence
Campaign Overview
All campaigns table, type distribution, daily performance time series
PMax Analyzer
Channel breakdown, spend allocation, asset group performance
Search Terms
Wasted terms, branded vs non-branded, campaign filtering
Wasted Spend
Zero-conversion products with conversion lag awareness
Market & Multi-Channel
Competition & Pricing
Price benchmarking, competitive visibility, category leaders
Organic Performance
Free listing clicks, impressions, and CTR from Google Shopping
Meta Ads Analytics
Facebook & Instagram product-level performance with daily charts
Cross-Channel
Google Ads + Meta Ads unified view with channel overlap analysis
Who needs SKU Analyzer?
SKU Analyzer is built for anyone managing Google Shopping ads who needs deeper product-level analytics and insights.
Ecommerce Managers
Track product performance across your entire catalog
Performance Marketers
Optimize ROAS with SKU-level insights
Marketing Analysts
Analyze trends and benchmark performance
Ecommerce Directors
High-level portfolio visibility and reporting
Agency Consultants
Manage multiple client accounts efficiently
Category Managers
Track category and product type performance
Retail Analytics Teams
Centralize Shopping data for team analysis
Digital Marketing Directors
Strategic oversight of paid Shopping channels
Before You Connect
A few things to know before getting started with SKU Analyzer.
Admin Access Required
You must have admin rights to the Google Ads and Merchant Center accounts you want to analyze. Standard or read-only access won't work with the API.
Google Sign-In
Sign in with your Google account and authorize via Google OAuth. This is the secure, standard way to grant access without sharing passwords.
Conversion-Focused Data
SKU Analyzer uses standard Google Ads metrics with a focus on conversions. Your dashboard accuracy depends on your conversion tracking setup.
Your Data, Your Control
Complete transparency about what access SKU Analyzer requests and exactly what happens with your data.
Why SKU Analyzer Requests "Edit" Permissions
When you authorize SKU Analyzer, Google will show that the app is requesting edit access to your Google Ads and Merchant Center accounts. Here's why:
The Google Ads API and Merchant Center API do not offer view-only or reporting-only permission scopes. Google bundles read and write access together in their API permissions. This is a limitation of Google's API design, not a choice.
SKU Analyzer Guarantee: Read-Only Operations
SKU Analyzer will NEVER make any edits, changes, or modifications to your Google Ads campaigns, Merchant Center products, or any account settings. The app only reads and displays your data.
SKU Analyzer FAQ
What data do I need to get started?
You need a Google account with admin access to both Google Ads and Merchant Center. SKU Analyzer connects via Google's secure OAuth—no API keys, credentials, or manual exports needed. Once connected, your Shopping Ads performance data and Merchant Center product data sync automatically.
Can I try it before connecting my accounts?
Yes. SKU Analyzer has a fully interactive demo dashboard loaded with sample data. You can explore every feature—Overview, Product Explorer, Product Radar, Portfolio Analytics, Competition Intelligence, and Wasted Spend Analysis—without signing in or connecting any accounts.
How long does setup take?
About 2 minutes. Sign in with Google, select your Google Ads and Merchant Center accounts, and wait for the initial data sync. The sync typically takes 1-3 minutes depending on your catalog size, and you'll see data loading progressively as it completes.
How is this different from Google Ads reports?
Google Ads shows campaign-level data and makes product-level analysis painful. SKU Analyzer shows product-level data—combining your Shopping Ads performance with Merchant Center attributes (brand, product type, custom labels), pricing intelligence, and competitive benchmarks. Filter by any feed attribute, see time series for individual products, and analyze performance in ways Google Ads UI simply doesn't support.
What metrics can I track?
All the important ones: Cost, Conversion Value, ROAS, CPA, Conversions, Clicks, Impressions, CTR, CPC, Conversion Rate, AOV, Impression Share, Click Share, and Top Impression Share. Every metric comes with trend lines, sparklines, and period-over-period comparisons. You can also see Merchant Center data like price competitiveness benchmarks alongside your ads data.
Can I filter by custom labels?
Yes—all 5 custom label fields from Merchant Center are fully supported. You can filter, segment, and analyze by any combination of custom labels, brands, product types, or drill down to individual SKUs. This is one of the main features that makes SKU Analyzer unique—Google Ads doesn't let you filter Shopping data by Merchant Center attributes.
How does price competitiveness work?
SKU Analyzer pulls benchmark pricing data from Google's Price Competitiveness reports in Merchant Center and displays it alongside your ads performance data. For each product, you'll see whether your price is above, at, or below the benchmark—helping you identify products that might be overpriced (hurting conversion rates) or underpriced (leaving margin on the table).
What are product intelligence labels?
SKU Analyzer automatically classifies every product in your catalog into actionable labels based on the last 14 days of performance: Hero (high spend, high return), Scale (efficient but low spend), Cash Cow (steady converters), Opportunity (potential with more visibility), Fix Price and Fix Listing (underperformers with clear causes), Cut (spending with zero return), and Monitor (low activity). Labels update daily so you always know where to focus.
How does wasted spend analysis work?
The Wasted Spend page identifies products consuming budget without delivering conversions. What makes it unique is conversion lag awareness—Google can attribute conversions to clicks up to 7+ days later, so recent zero-conversion products might just be waiting for attribution. SKU Analyzer separates confirmed waste (enough history to be confident) from at-risk spend (still within the attribution window), so you don't cut products prematurely.
Is my data secure?
Yes. SKU Analyzer uses Google OAuth for authentication—your Google credentials are never seen or stored by the app. Your data is stored securely in isolated database tables and is only accessible to you. You can revoke access anytime from your Google account settings, and you can delete all your data from within SKU Analyzer at any time.
Can I delete my data?
Yes, at any time. You can delete all your data from within the dashboard. You can also revoke SKU Analyzer's access from your Google account permissions page, which immediately stops all data access. Your data is never shared or sold.
Why does the app request edit permissions?
Google's API design bundles read and write access together—there's no "view-only" scope for Google Ads or Merchant Center APIs. SKU Analyzer never writes to or modifies your accounts in any way. It only reads performance data and product information. The "edit" permission is just a requirement to access the reporting data you need.
What campaign types are supported?
SKU Analyzer works with Shopping campaigns, Performance Max campaigns that include Shopping inventory, and Demand Gen campaigns. The dashboard shows product-level performance data regardless of which campaign type is driving the impressions and clicks.
Can I connect multiple accounts?
Not yet. Currently each user can connect one Google Ads account and one Merchant Center account. Multi-account support is planned for the future.
How often is data refreshed?
Data refreshes automatically once per day. The refresh pulls the last 10 days of data to ensure conversion attribution is accurate. Product feed data from Merchant Center is also updated daily to reflect any changes to your product catalog.
Can SKU Analyzer manage my product feed?
Yes — the Custom Labels rule builder auto-classifies products by performance and pushes labels to Merchant Center. Title Optimizer lets you build templates and push optimized titles via supplemental feed. Feed Intelligence tracks daily feed changes including price history and availability.
Does it show search term data for Shopping campaigns?
Yes — full search term reports with wasted term detection, branded vs non-branded analysis, and campaign-level filtering. See exactly which search queries are triggering your Shopping ads and which ones are eating budget without conversions.
Can I see a Performance Max channel breakdown?
Yes — SKU Analyzer shows where PMax allocates spend across Shopping, Search, Display, YouTube, and Discover, with daily trends, channel-level KPI cards, and asset group performance metrics.
Can I push custom labels to Merchant Center?
Yes — the rule builder lets you define conditions based on ROAS, spend, conversions, and pricing, then automatically pushes labels to Merchant Center via supplemental feed. Labels recalculate daily so your campaigns always use current performance data.
Interested in SKU Analyzer?
Leave your email and I'll be in touch with access details.
Not ready to connect your accounts? Try the demo first
Questions? Email me