Why I Built SKU Analyzer

Samuli Kesseli
10+ years managing Google Ads accounts · Millions in ad spend across countless companies · 50M+ in generated revenue
Senior consultant by day, builder of things by night. I've worked with small startups, big corporations, and everything in between. SKU Analyzer is my answer to the frustration of analyzing — and fixing — Shopping Ads campaigns.
I have worked with too many Google Ads accounts to count, most of them with some sort of shopping campaigns—either normal Shopping campaigns, Performance Max, Smart Shopping or DemandGen. One thing has always been constant when I analyze results or try to optimize and grow these accounts: getting a good picture of product performance, especially on larger product catalogs, is an absolute nightmare.
The Google Ads UI Problem
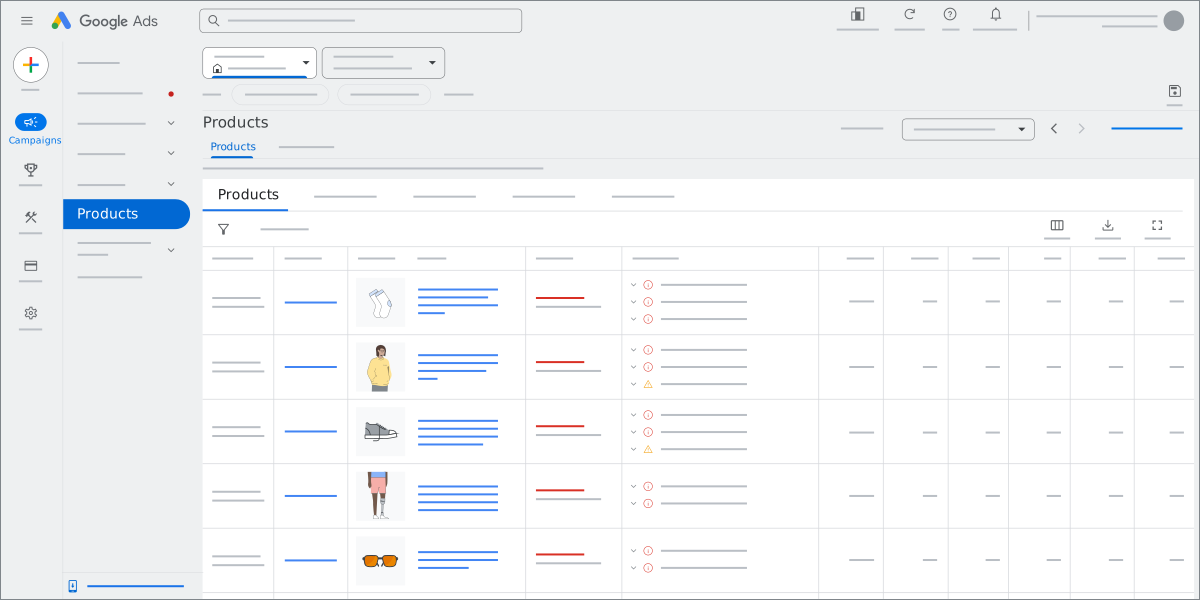
Google Ads UI is absolutely horrible for analyzing product-level data. You can usually see just one table with summary data and one or two metrics. Not visually pleasing, but more importantly, not great for analyzing the performance. It makes understanding product/category trends really hard, comparing is near impossible.
Splitting by product types, custom labels, brand, or any other segment is hard. Comparing different segments is also hard. Recognizing what products and categories are working, what should be scaled—all possible, but requires manual work and is slow. To top all that, in most cases you can have one product in 2-5 different campaigns depending on your setup, and differentiating specific product visibility in those campaigns is a struggle to say the least.
Google Ads custom reports and Looker dashboards definitely help, but they are very limited as well. They also show just Google Ads data, and some scopes are limited. Looker dashboards have their own issues when you have enough data. Taking data to something like BigQuery through APIs and from there visualizing it somewhere is plausible, but requires a lot of work and know-how.
The Merchant Center Disconnect
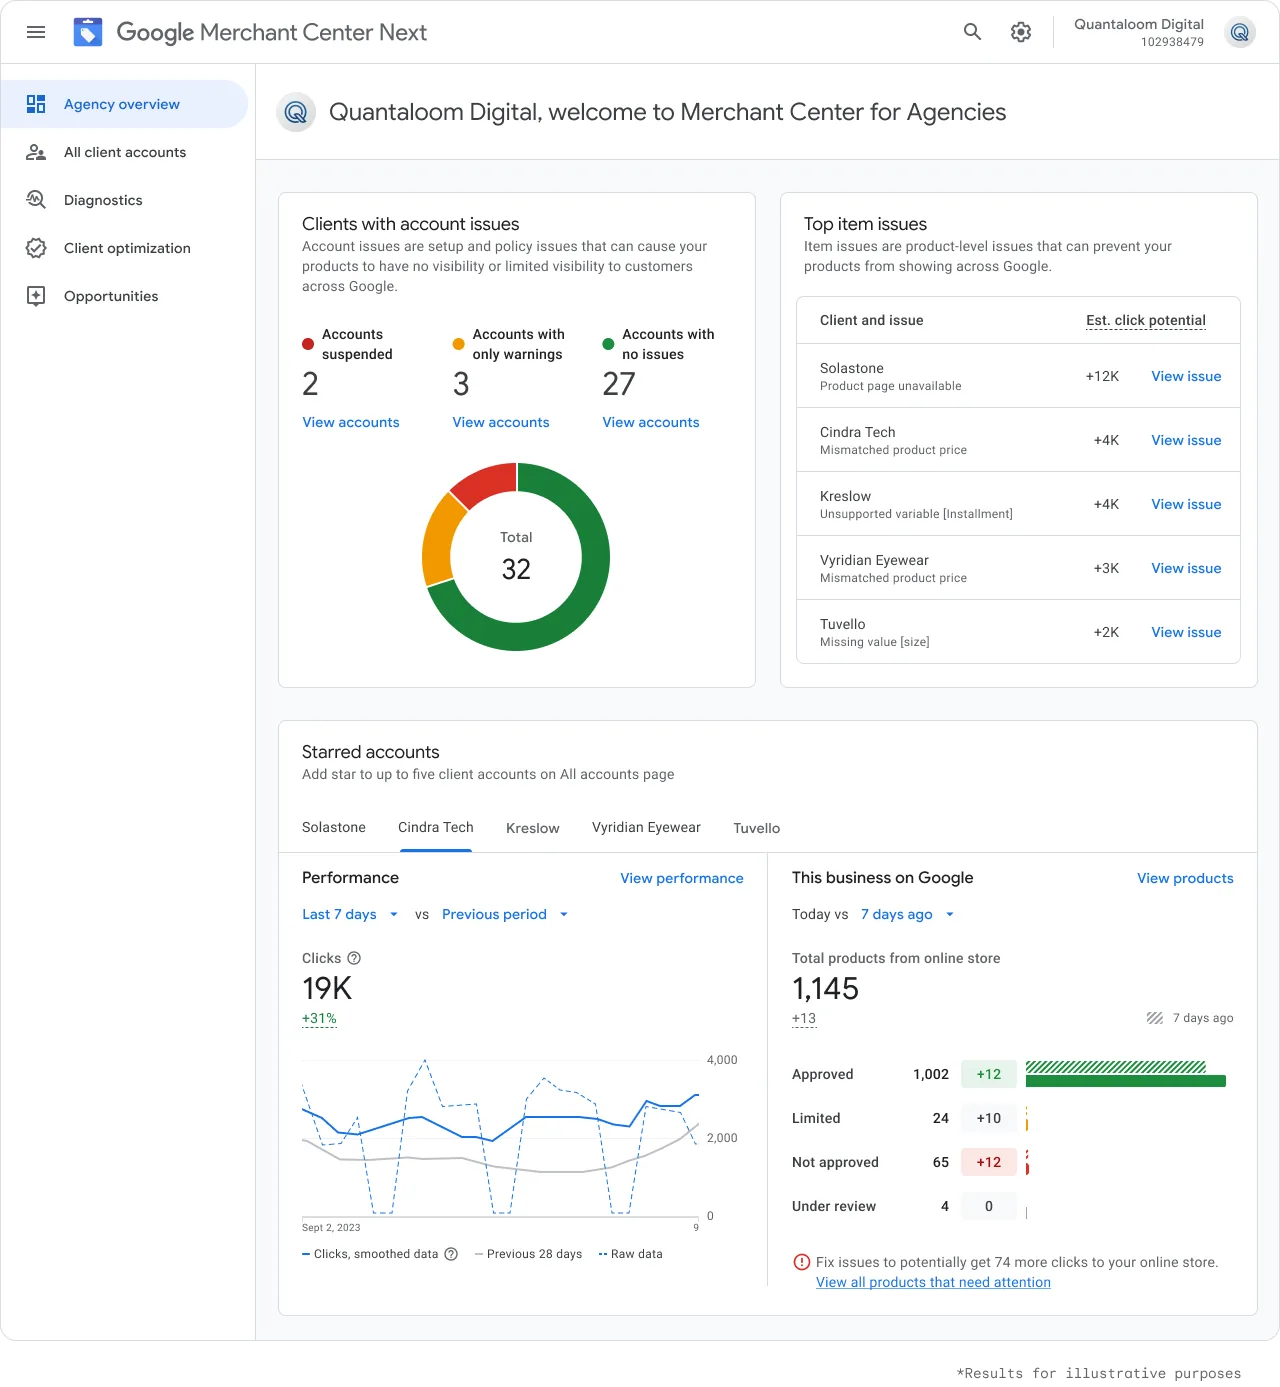
Google Ads API is one thing, but then there's the other side: Merchant Center and the data it offers. There is so much useful information—from the product feed itself to competition benchmark prices per product and beyond. These are COMPLETELY SEPARATE, so taking use of both is not possible, except checking one first and the other after that.
Merchant Center has a very basic Google Ads connection, but the data visualization is abysmal there—just one summary table of imported conversions from Google Ads. So again, in theory it is possible to connect data sources. In practice, not really. Going through the competition pricing benchmarks in Merchant Center UI is also painful.
What I Actually Needed
So I wanted a tool that:
- Combines Merchant Center data like product feed with all variables, competition price benchmarks, category competition & visibility with Google Ads shopping performance data, like cost, clicks, all conversion metrics, impression share metrics, etc.
- Allows me to easily visualize product-level Google Shopping ads performance data in different formats, and most importantly allows me to filter the data based on ANY feed variables, not just those that Google Ads UI allows you to use
- Allows me to cross-analyze this data: Is a product selling better because our prices are lower than competition on average? How much of the shopping ads market do we have in terms of impression share or click share? Can we scale this product or category further? How much is the market average price for this product? Is my product feed ok or are there errors? Net profit per product?
- Saves feed data for later use: Merchant Center feed info is always a snapshot from that day. There is basically no historical data (apart from approvals), so I wanted my tool to save the information so I can compare historical prices and competitor prices to performance.
- Lets me act on what I find — push updated titles, custom labels, and other feed attributes back to Merchant Center via a supplemental feed, and A/B test those changes against baseline performance.
The Search for an Existing Solution
After putting three different AI tools on deep research mode to find me this sort of tool/service I could buy, and all of them coming empty-handed, I realized I need to build my own.
There are many feed management tools like Channable and Producthero, and analytics middleware like Supermetrics (I'm a big fan and user of many years). None of them were quite what I was after on their own. The feed tools are great at manipulating the feed but blind to ad performance, and the analytics middleware visualizes Google Ads numbers but leaves the feed untouched. I wanted one tool that does both — makes sense of product-level performance and lets me act on it: edit Merchant Center feeds through supplemental feeds, rewrite titles, A/B test those changes, push custom labels — without leaving the dashboard.
SKU Analyzer
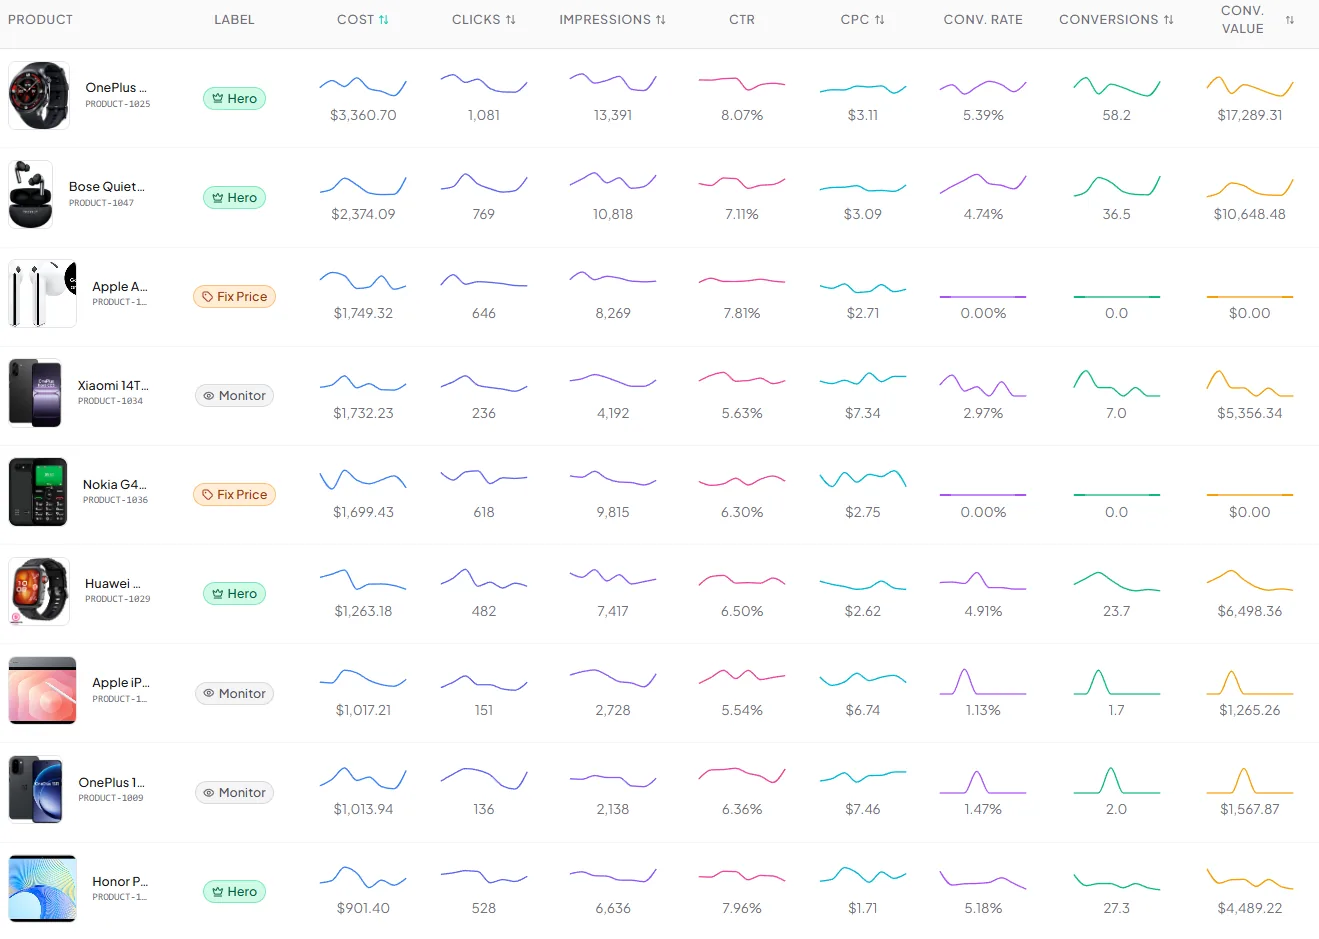
So SKU Analyzer was born. Generic and boring name, I know, but in my defense: a) it describes what the product does, and b) it started as a placeholder name and then before I realized it, I was too far into building. Switching takes too much effort, so SKU Analyzer it is.
Demo is completely open for anybody to browse: dashboard.skuanalyzer.com/demo. It is obviously generated data, but it shows what you could see if you start using SKU Analyzer with your own Google Ads & Merchant Center accounts. Note that some competition data is limited based on your advertising spend and if Google has enough data on your specific category.
It is crazy to me that shopping campaigns, that companies spend huge amounts of money on, are still so hard to really analyze properly. Analysis is only half the job — the other half is being able to act on it without exporting CSVs or jumping between three dashboards. My hope is that my tool helps advertisers optimize their own campaigns better to improve ROAS, CPA, or whatever metrics you are aiming for.
—Samuli
Disclosure: The company I work for, Columbia Road, is not associated with SKU Analyzer in any way. This is totally my own project, which I built initially for my own use, to be used on my current clients' accounts.
Interested in trying SKU Analyzer?
I'm currently onboarding users on an invite-only basis. Leave your email and I'll be in touch with access details. You'll get full access to all features and up to 2 years of historical data.
What you need:
- Google Ads and Merchant Center accounts with data to display
- Admin access to both accounts
In exchange for the access, I only ask for feedback in return.