SKU-Level Product Analytics for Google Shopping
Every product in your Google Shopping catalog with 15+ performance metrics per SKU. Click any product for full daily time series, impression-share trends, and price history. Filter by brand, product type, intelligence label, or any of the five custom-label fields from your Merchant Center feed.
No signup required to explore the demo.
Every product in your catalog
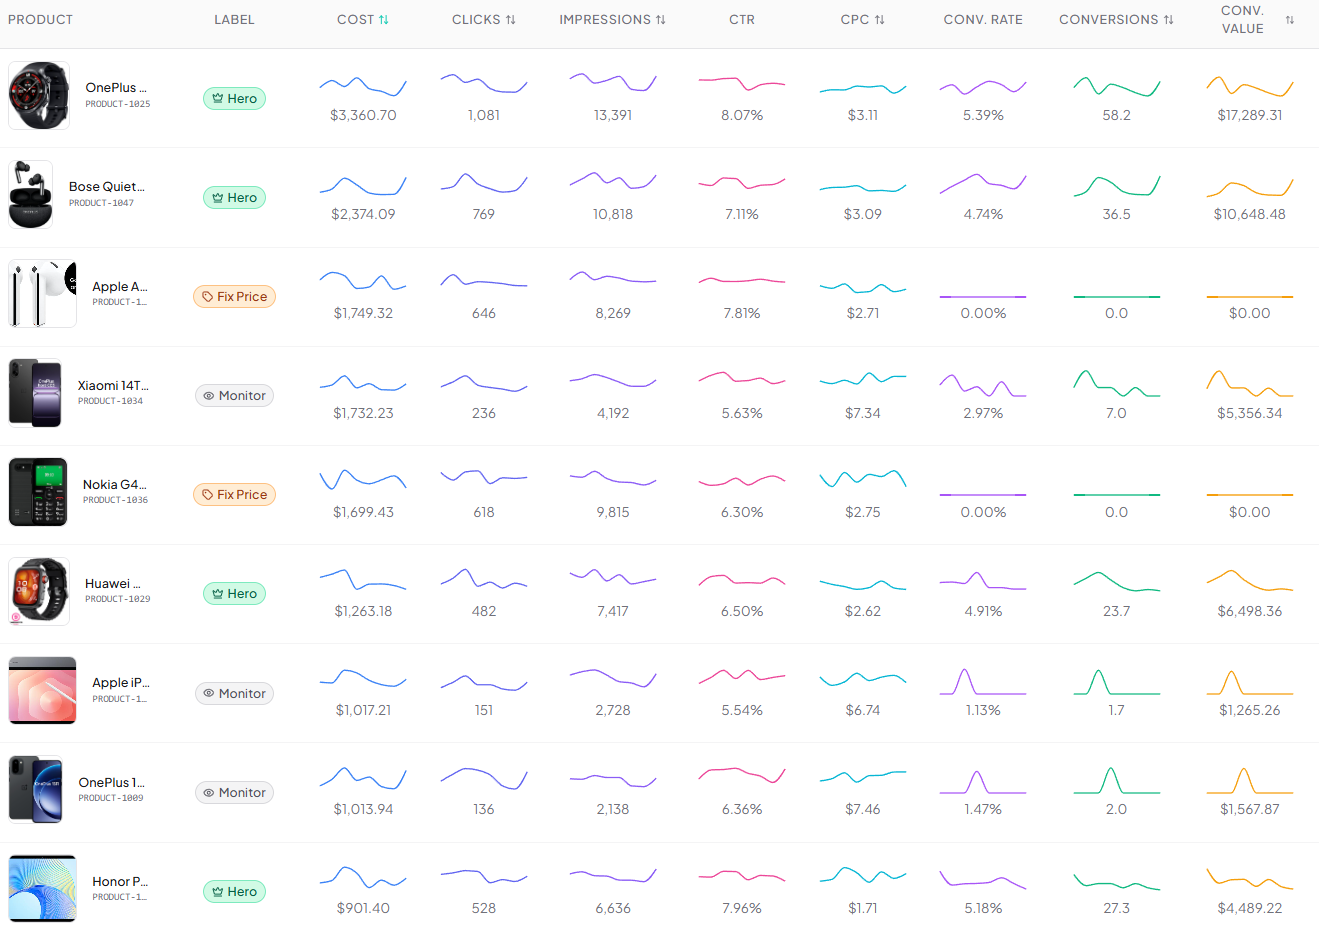
A sortable SKU-level table with everything Google Ads makes you click around to find — plus a per-product drilldown.
-
✓
Every SKU in one sortable table — 15+ columns covering cost, clicks, impressions, CTR, CPC, conversions, conv. value, ROAS, CPA, conv. rate, impression share, top impression share, click share, and Merchant Center attributes.
-
✓
Inline sparklines when "Show Trends" is on — every numeric column gets a small chart in the row.
-
✓
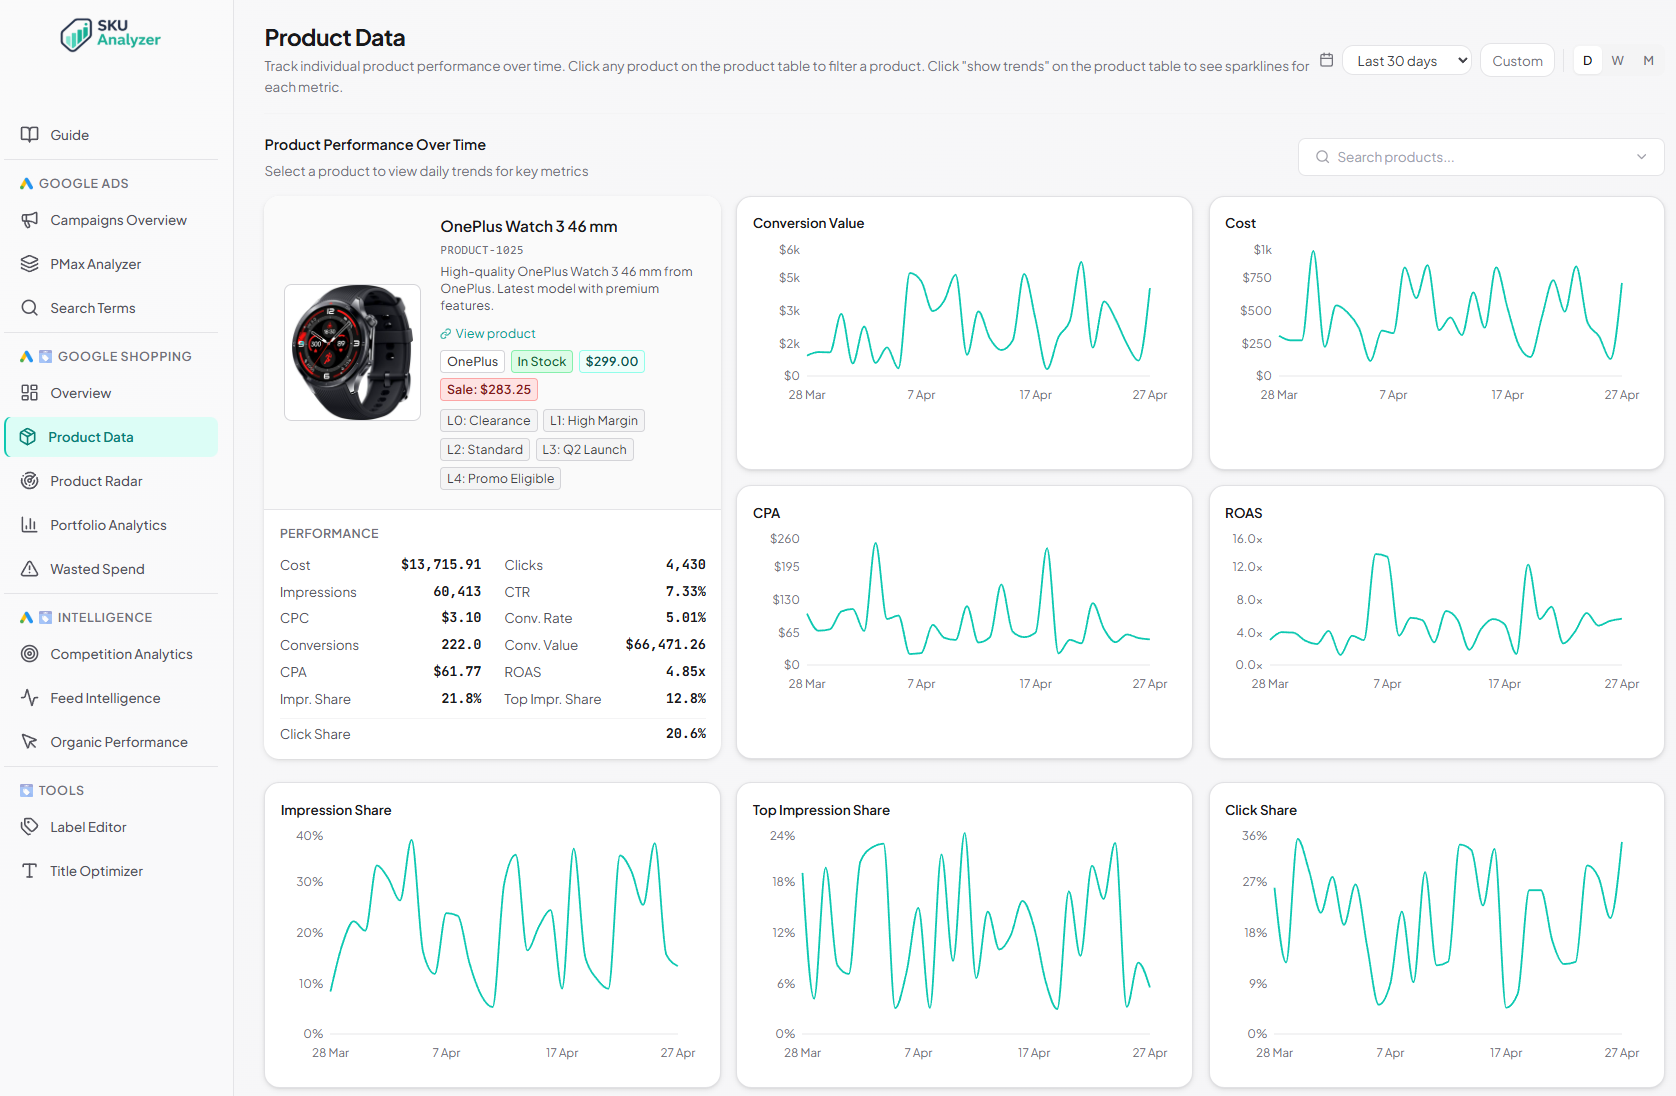
Click any product to drill in: daily time series across every metric for that single SKU, controlled by the date-range picker.
-
✓
Impression-share trio per product — Impression Share, Top Impression Share, and Click Share plotted day by day for the selected SKU.
-
✓
Price-history chart built from daily feed snapshots — price over time, sale price on a dashed line, out-of-stock periods shaded.
-
✓
Eight filters: title/ID search, brand, product type, intelligence label, plus all five custom_label fields from your Merchant Center feed.