Feed Intelligence: Track Every Product Feed Change
Daily snapshots of your entire product feed and Merchant Center's competitive price benchmarks build into a historical record neither Google Ads nor Merchant Center keep. Watch price changes, availability shifts, and competitor moves day by day — the longer SKU Analyzer is connected, the richer the picture gets.
No signup required to explore the demo.
A historical record neither Google Ads nor Merchant Center keeps
Every price change, availability shift, attribute edit, and competitor move — captured daily and trended over time so you can see exactly when something moved.
-
✓
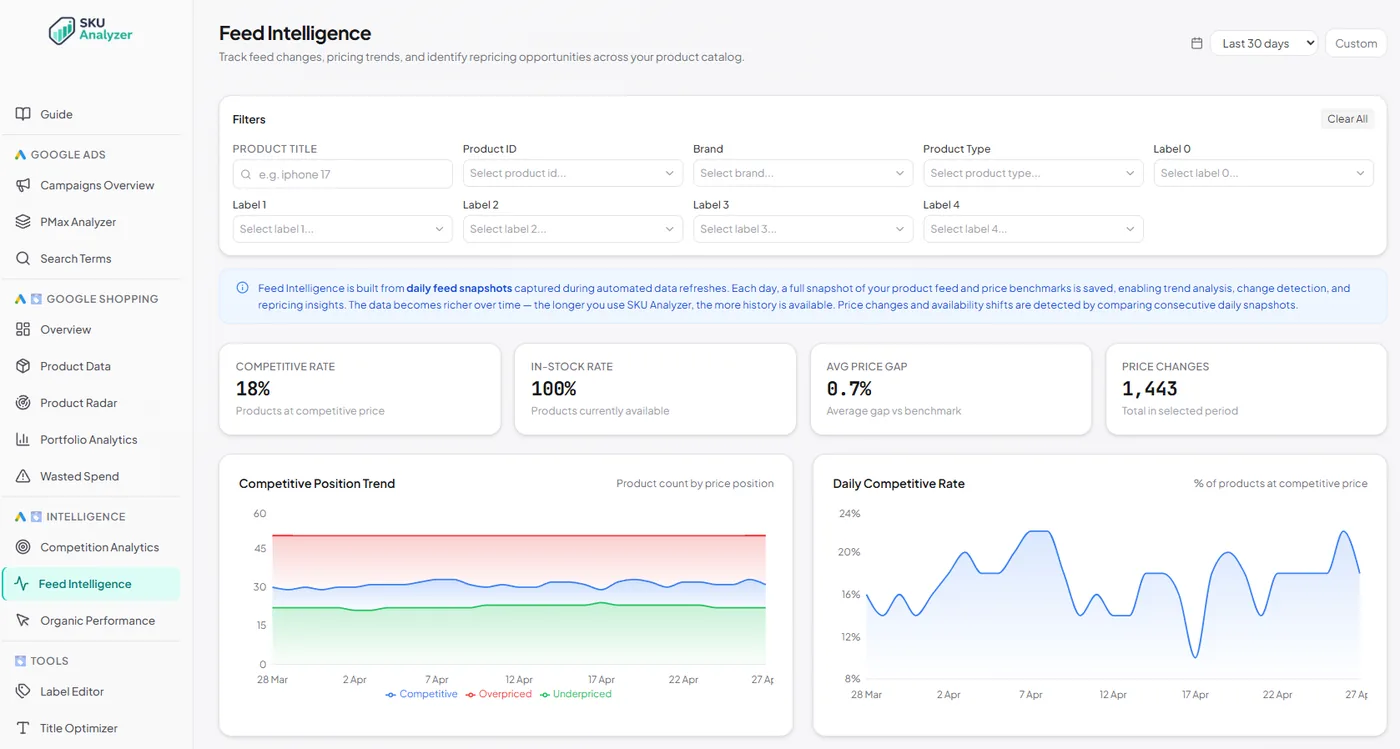
Four headline KPIs — Competitive Rate, In-Stock Rate, Avg Price Gap, and total Price Changes — recalculated for whichever segment you filter to.
-
✓
Nine filters at the top — product title, product ID, brand, product type, and all five custom_label fields — narrowing every chart and the table below.
-
✓
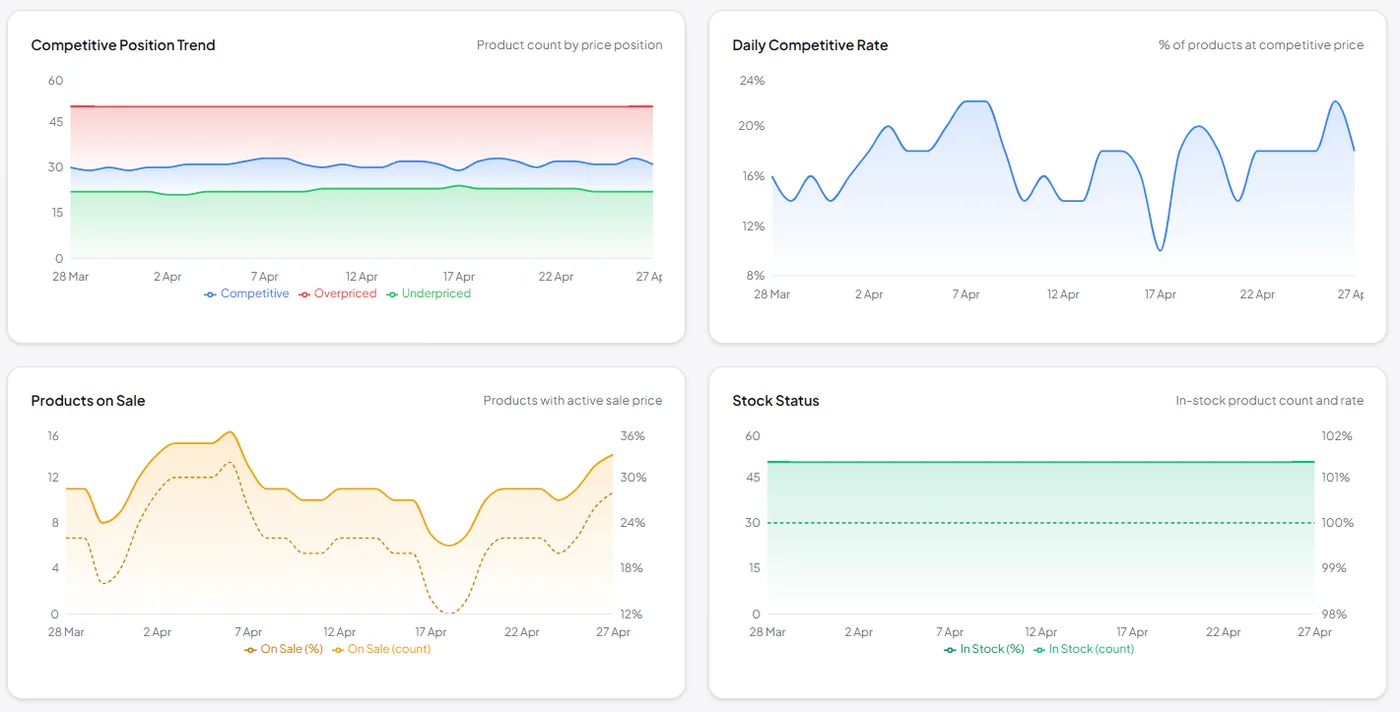
Competitive Position Trend — daily stacked area of how your catalog splits between overpriced, competitive, and underpriced products.
-
✓
Daily Competitive Rate — the share of your catalog priced within the competitive band, plotted day by day.
-
✓
Products on Sale + Stock Status — how many SKUs are actively discounted and in/out of stock, day by day.
-
✓
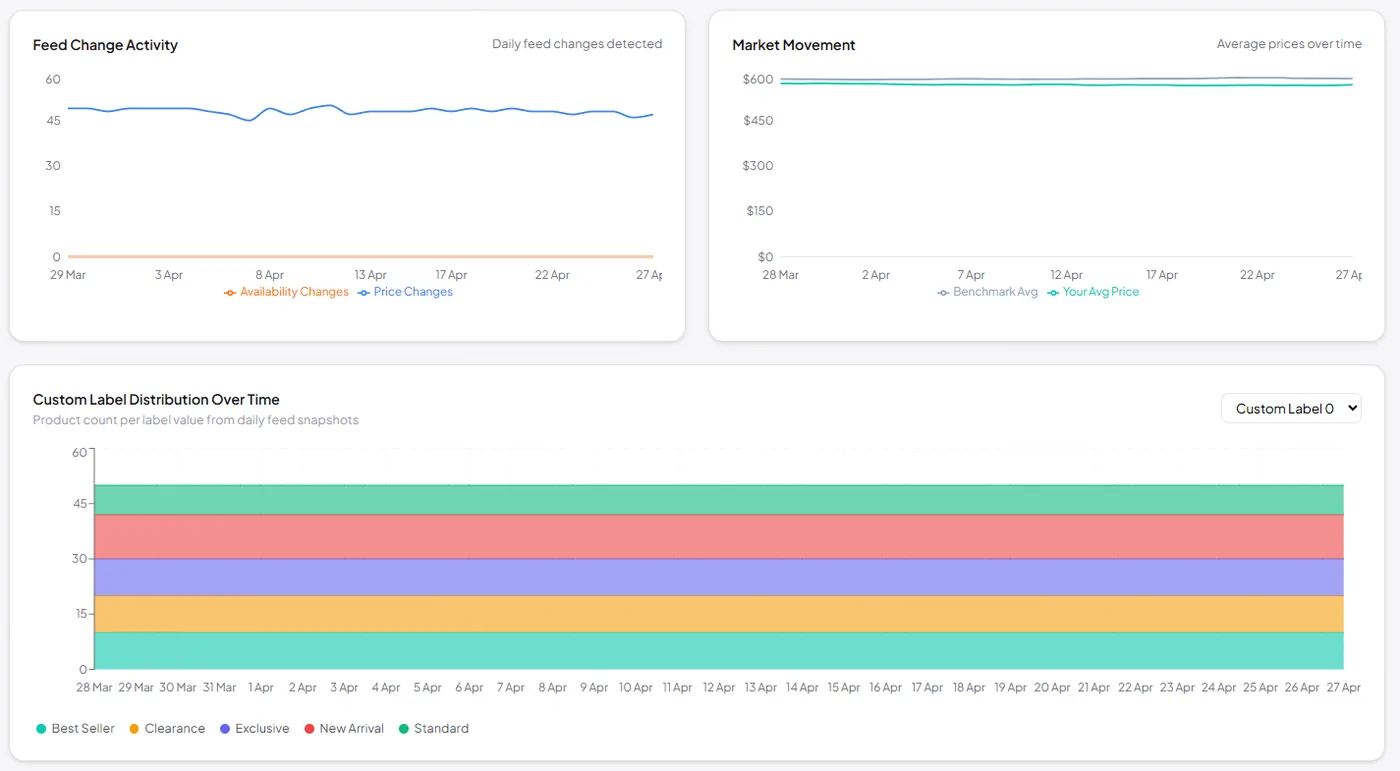
Feed Change Activity — daily count of price, availability, and attribute edits, so you see exactly when the feed moved.
-
✓
Market Movement — competitor price activity in your categories over time.
-
✓
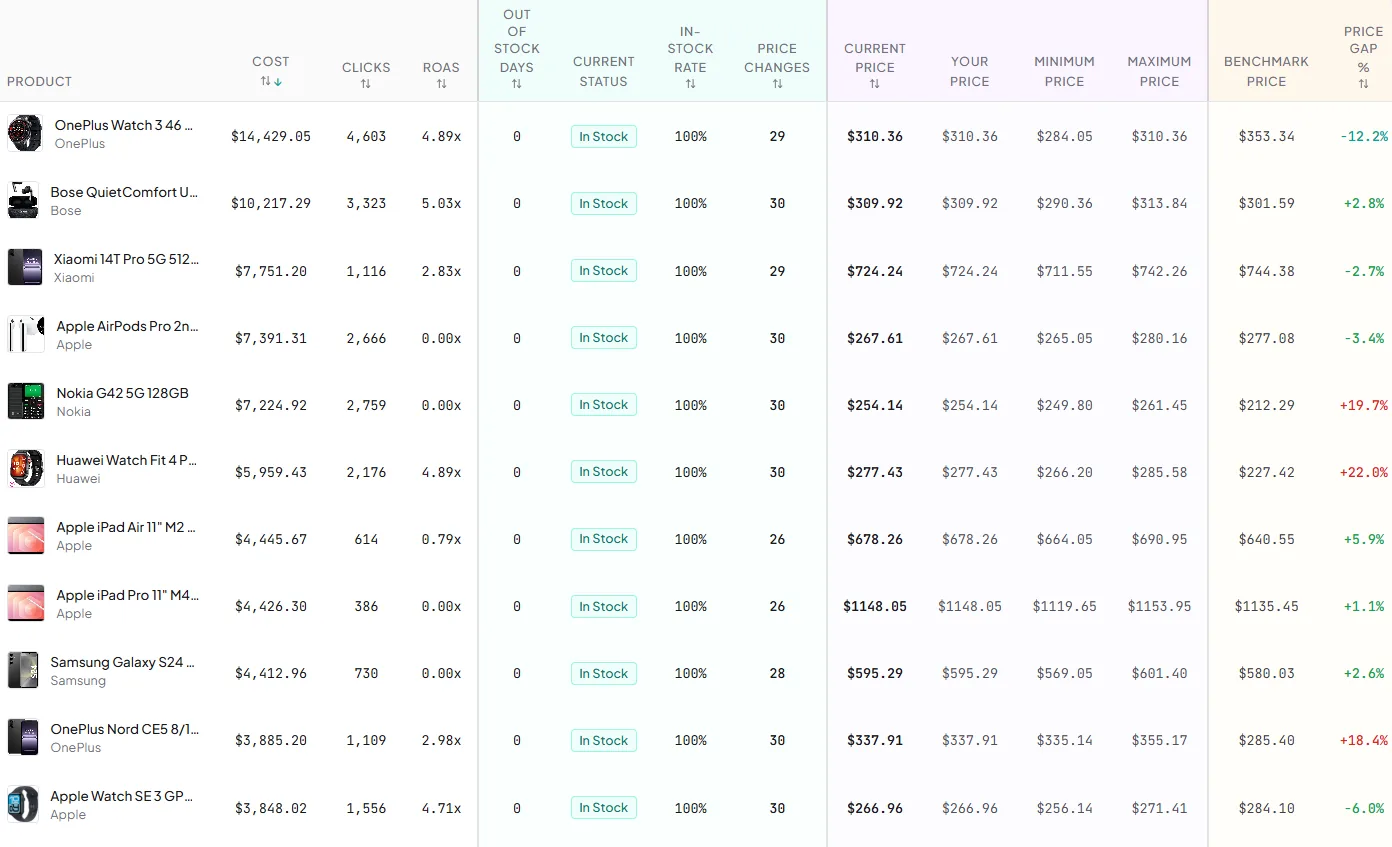
Custom Label Distribution Over Time, a Pricing Competitiveness by Segment breakdown (avg price vs benchmark and position mix per brand, category, or custom label), and feed offenders — the SKUs with the most stockout days and the most price changes.
Feed Health: which products can actually serve, and what is blocking the rest
Feed history tells you what changed. Feed Health tells you what is broken right now — every disapproval, warning, and pending review in Merchant Center, ranked by what it is costing you, with the issue history behind it.
-
✓
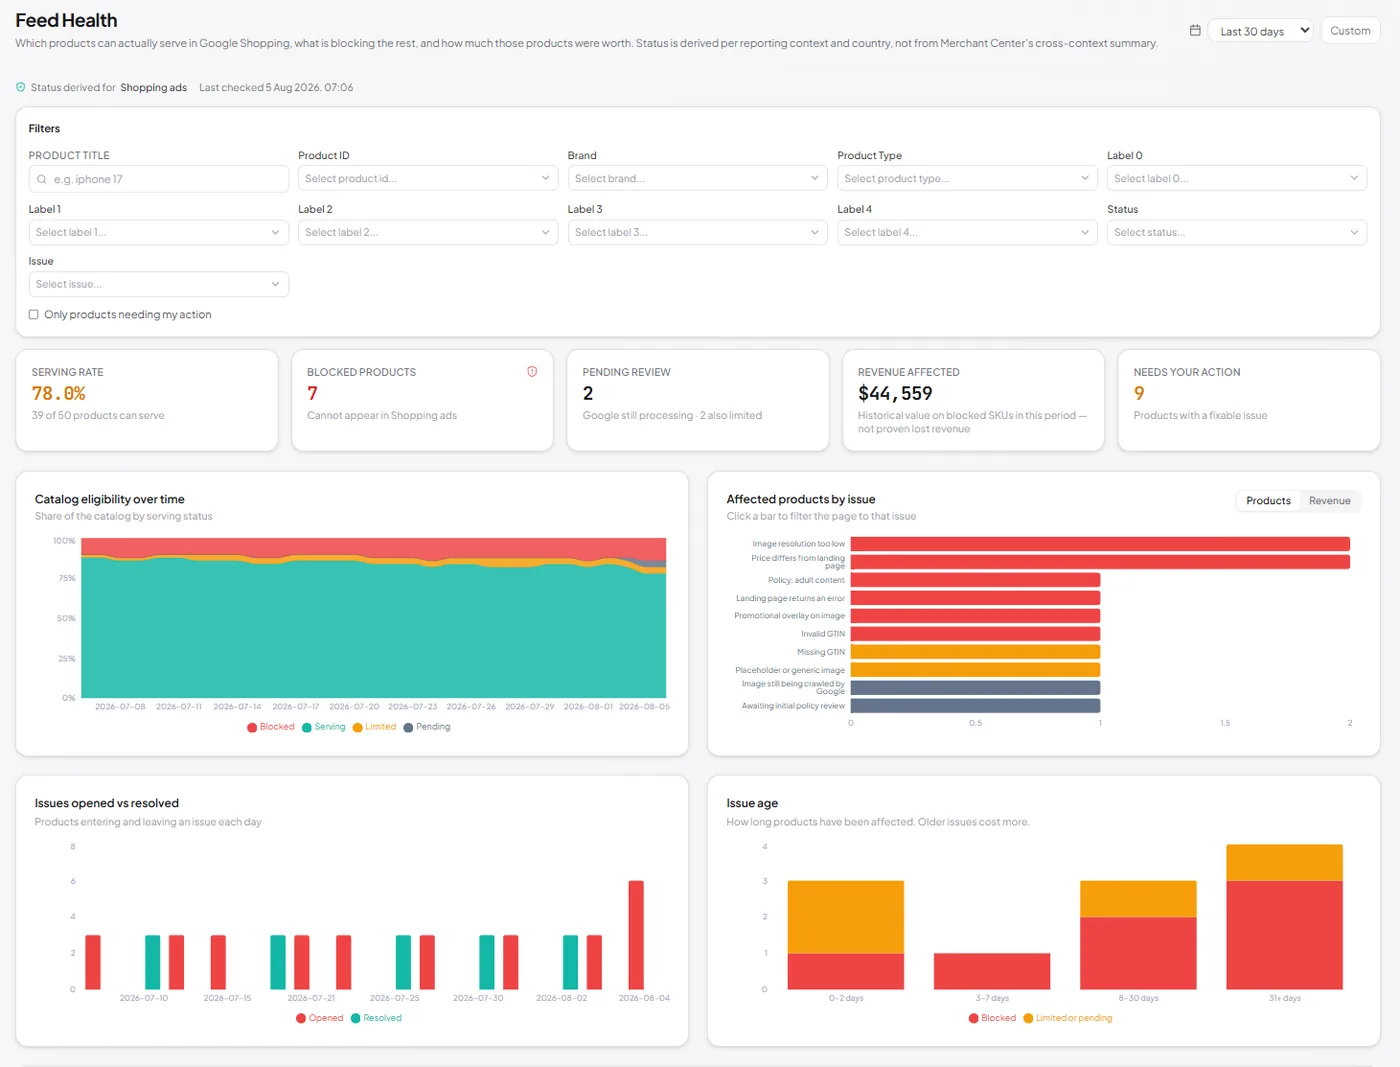
Five headline KPIs — serving rate, blocked products, pending review, revenue affected, and how many issues are yours to fix rather than Google's to finish processing.
-
✓
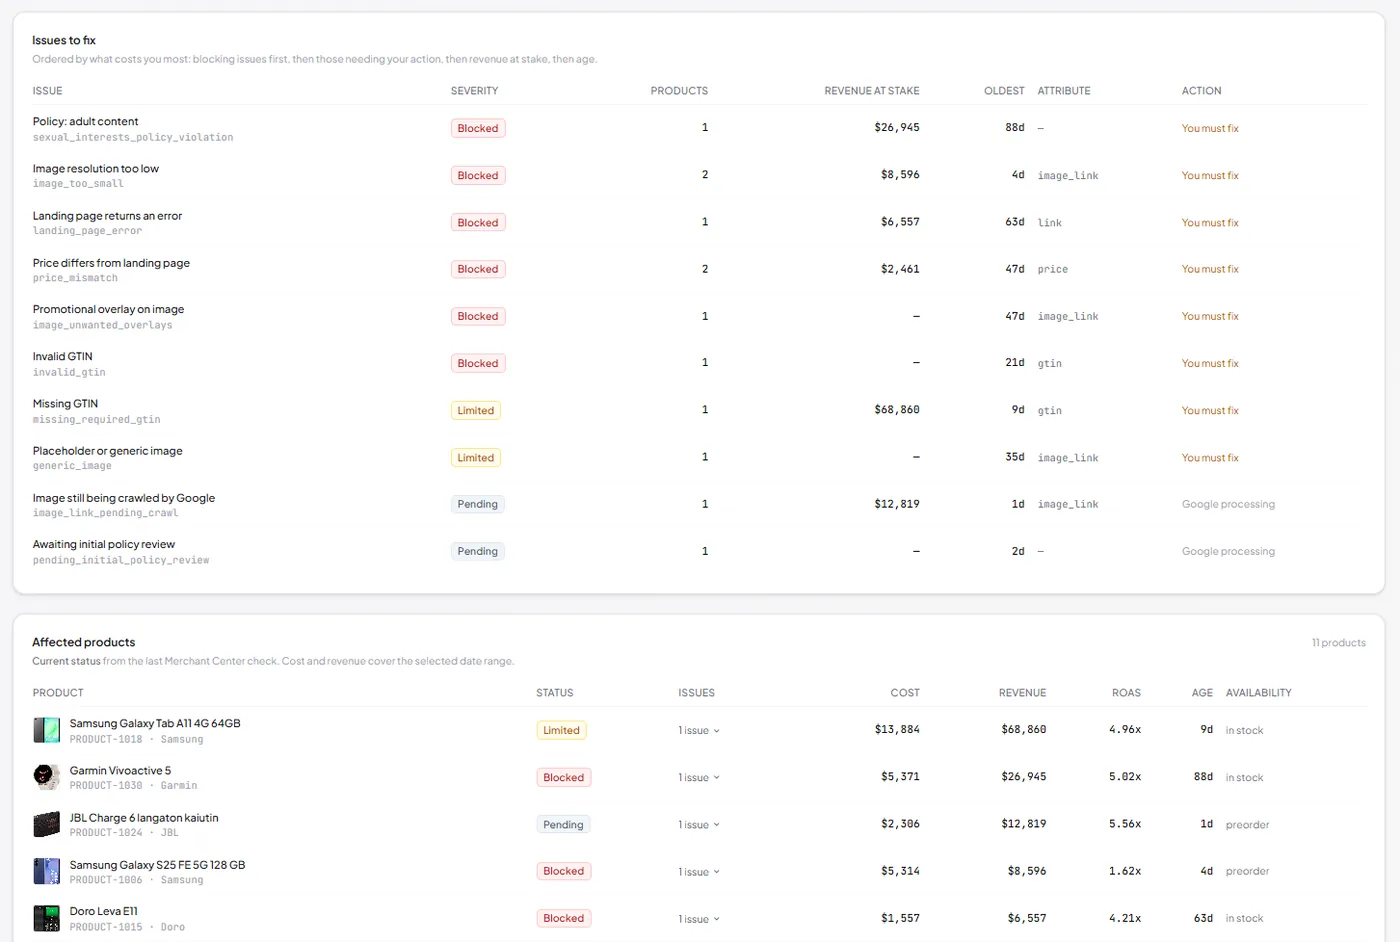
Issues ranked by cost, not alphabetically — blocking issues first, then the ones needing your action, then revenue at stake, then age. Each row carries the raw Merchant Center issue code and the feed attribute at fault.
-
✓
Catalog eligibility over time — the share of your catalog serving, limited, blocked, or pending, plotted daily, so a slow bleed is as visible as a sudden mass disapproval.
-
✓
Issues opened vs resolved and issue age — whether you are keeping up with the feed, and which problems have been quietly sitting there for a month.
-
✓
Affected products by issue, switchable between product count and revenue — one image error on a bestseller outranks ten on products nobody buys. Click a bar to filter the whole page to that issue.
-
✓
Affected products table with the commercial context Merchant Center never shows: status, open issues, cost, revenue, ROAS, how long the product has been affected, and availability. Filterable by brand, product type, status, issue, or any custom label.
Related reading
What feed history is good for once you are collecting it.
- Merchant Center Tracking Feed Changes Over Time Price, availability and title history, and what to do with it. Read the guide →
- Merchant Center Finding & Fixing Feed Errors Resolving the disapprovals and warnings that pull products offline. Read the guide →
- Visibility & Competition Google Price Benchmarks Pairing your own price history with Google's competitive benchmarks. Read the guide →
- Merchant Center Product Feed Optimization The attributes worth getting right before anything else. Read the guide →