Google Shopping Campaign Overview & Performance Tracking
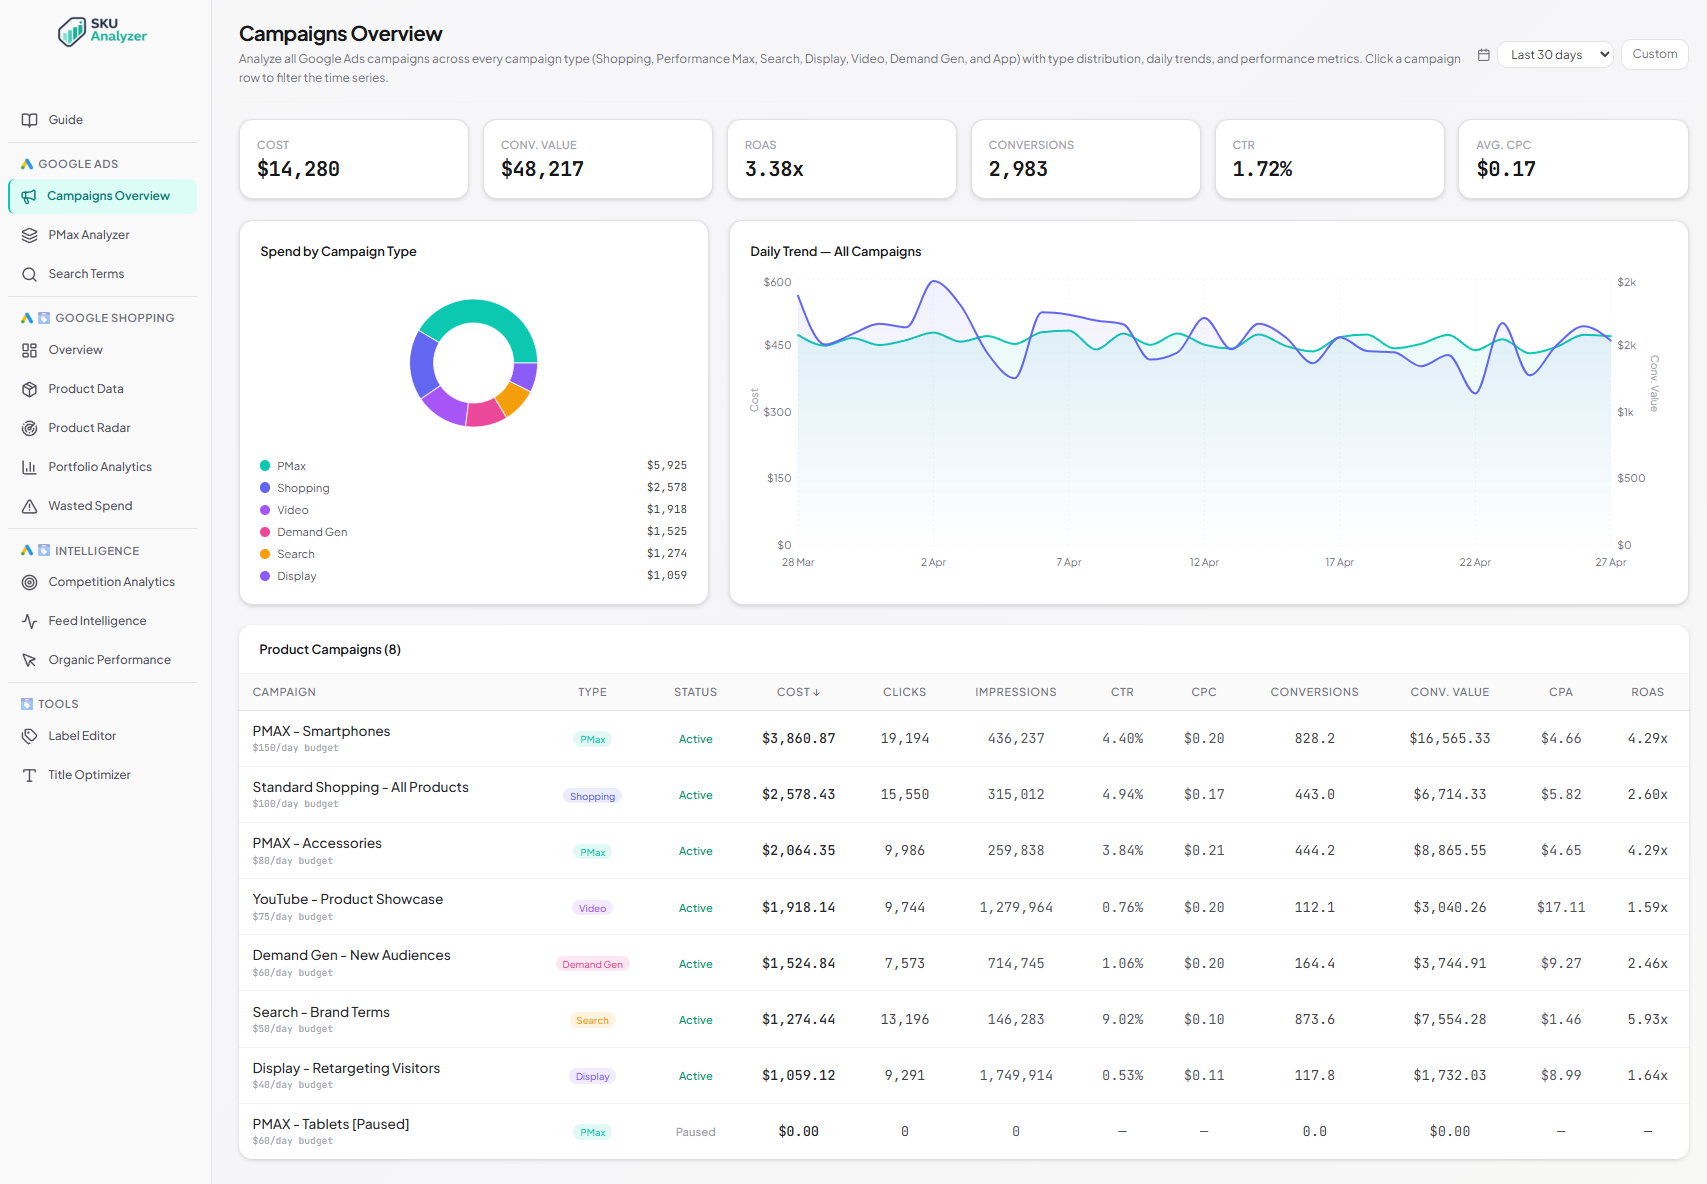
Every Shopping, PMax, Demand Gen and YouTube campaign in one sortable view. Spend split, daily trends, and KPIs across campaigns — without clicking between Google Ads tabs. Sort by any column and pick any date range up to 750 days.
No signup required to explore the demo.
A summary of every campaign you're running
Shopping, PMax, Demand Gen and YouTube — all in one place, with the basics you'd otherwise click through several Google Ads tabs to see.
-
✓
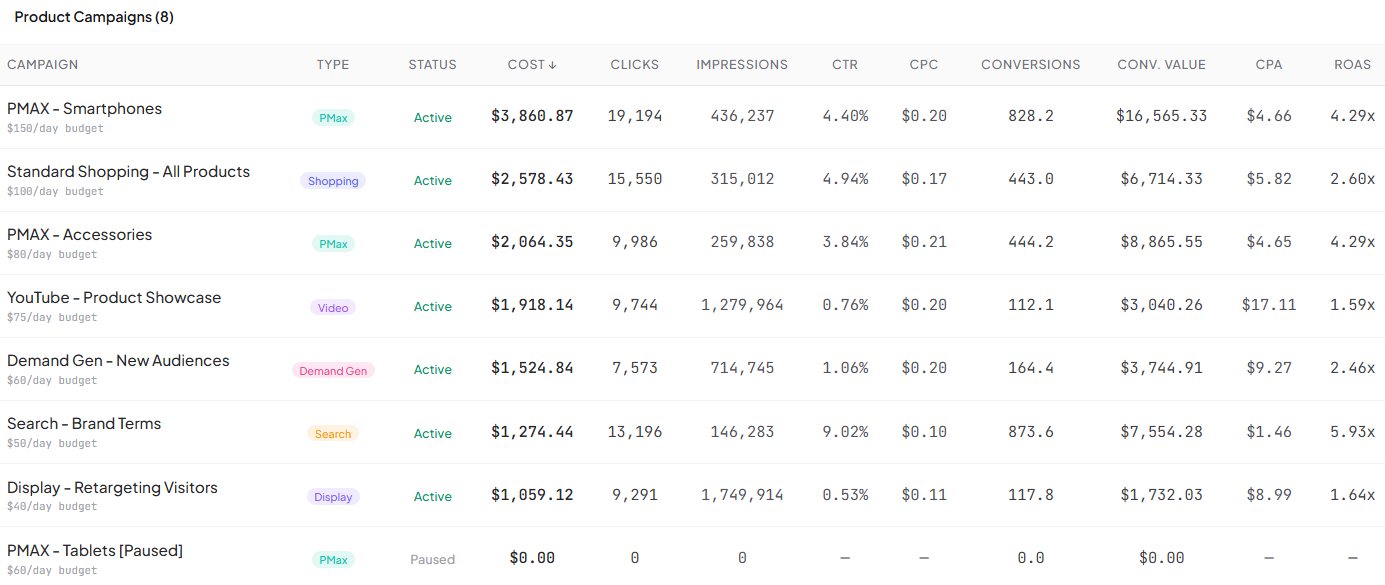
Every campaign in one sortable table — Shopping, PMax, Demand Gen and YouTube together, with cost, clicks, impressions, conversions, revenue, ROAS, CPA and CPC.
-
✓
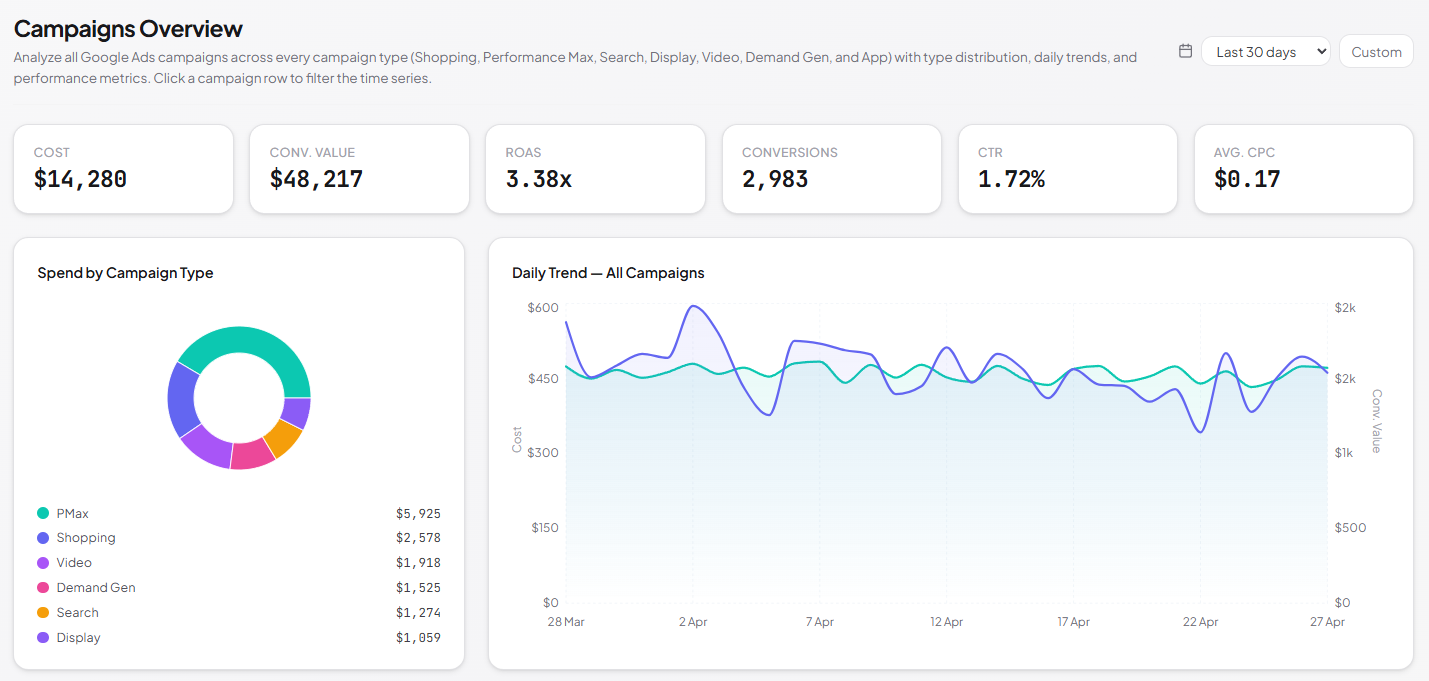
Daily time series of total cost, revenue and ROAS across the whole account, with hover tooltips for exact daily values.
-
✓
Donut chart showing how your budget splits across campaign types.
-
✓
Sortable on any column.
-
✓
Refreshes automatically every day.