Competitive Pricing Intelligence for Google Shopping
See how your Shopping visibility compares to competitors in every category, where every product sits against Google's market benchmark, and how the picture changes over time. Merchant Center's most valuable data — finally usable.
No signup required to explore the demo.
Merchant Center's competitive data, finally usable
Competitor visibility, price benchmarks, and category rankings — pulled from your Merchant Center, plotted over time, and wired into the rest of the dashboard.
-
✓
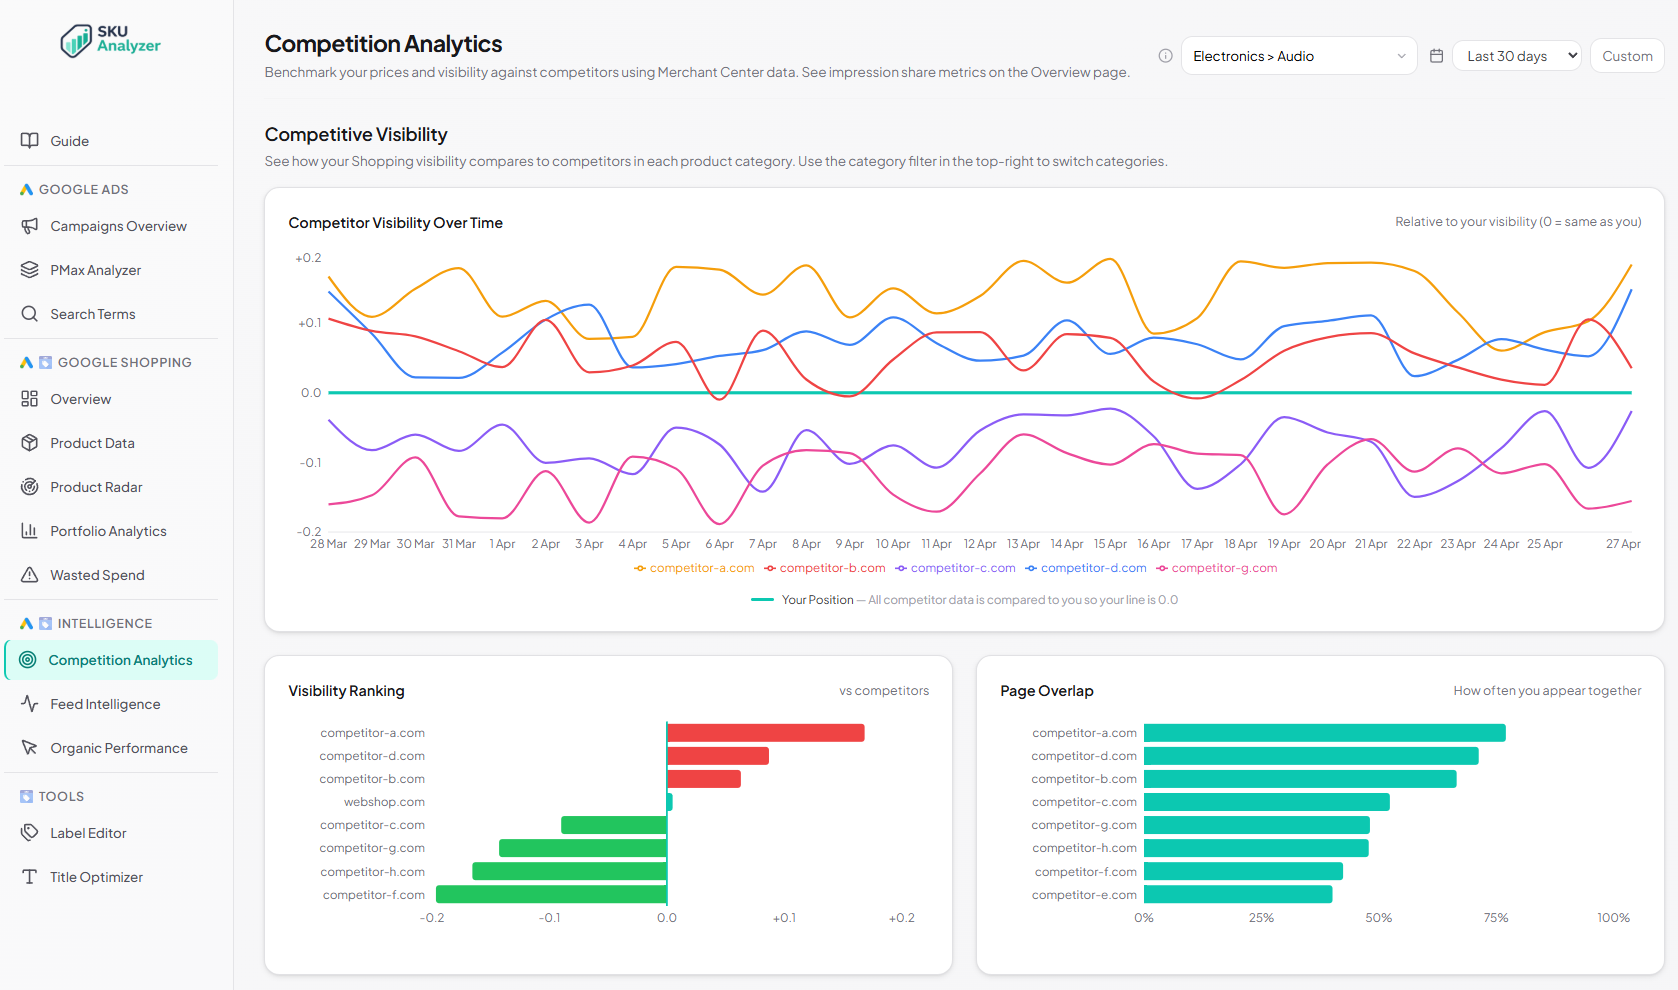
Competitor visibility over time — your top 5 competitors plotted relative to your visibility (0 = same as you), so you immediately see who is gaining or losing ground.
-
✓
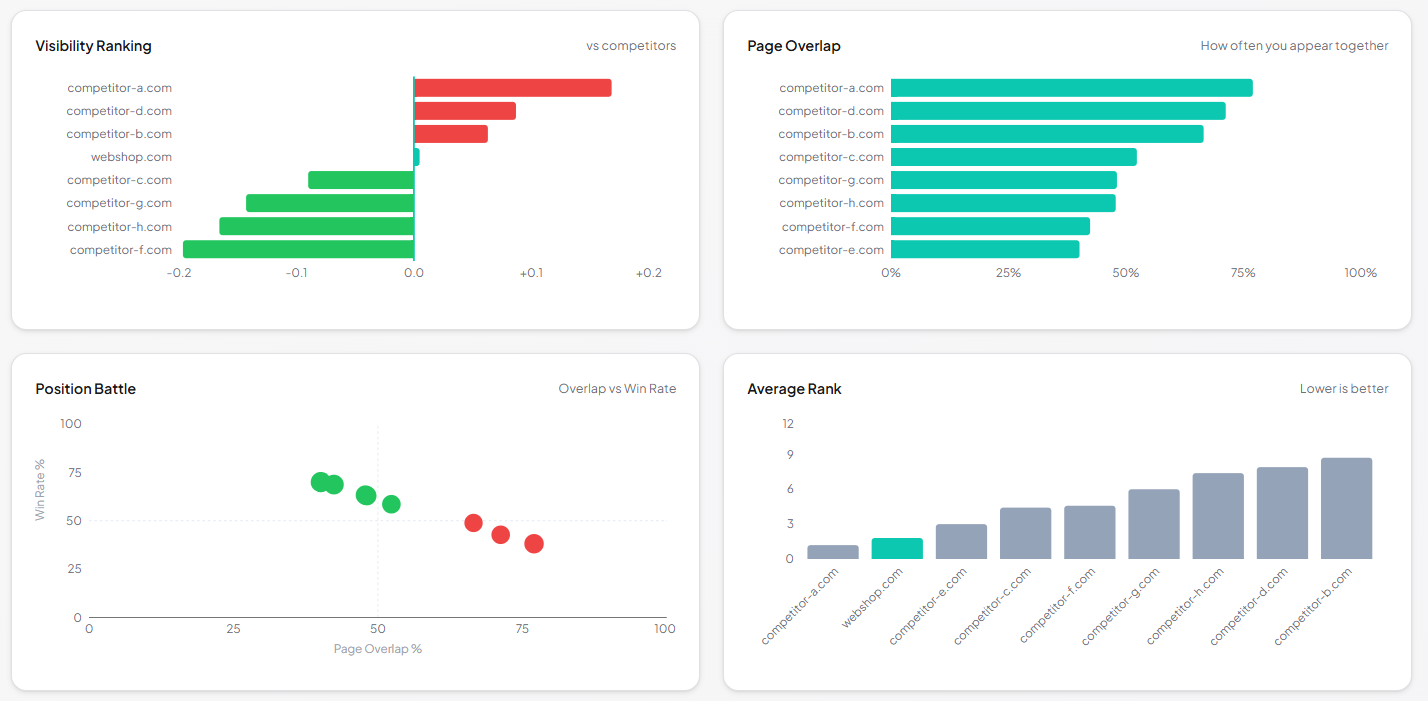
Multi-chart competitor comparison — visibility ranking, page overlap, position battle scatter, average rank, and ads-vs-organic mix, side by side.
-
✓
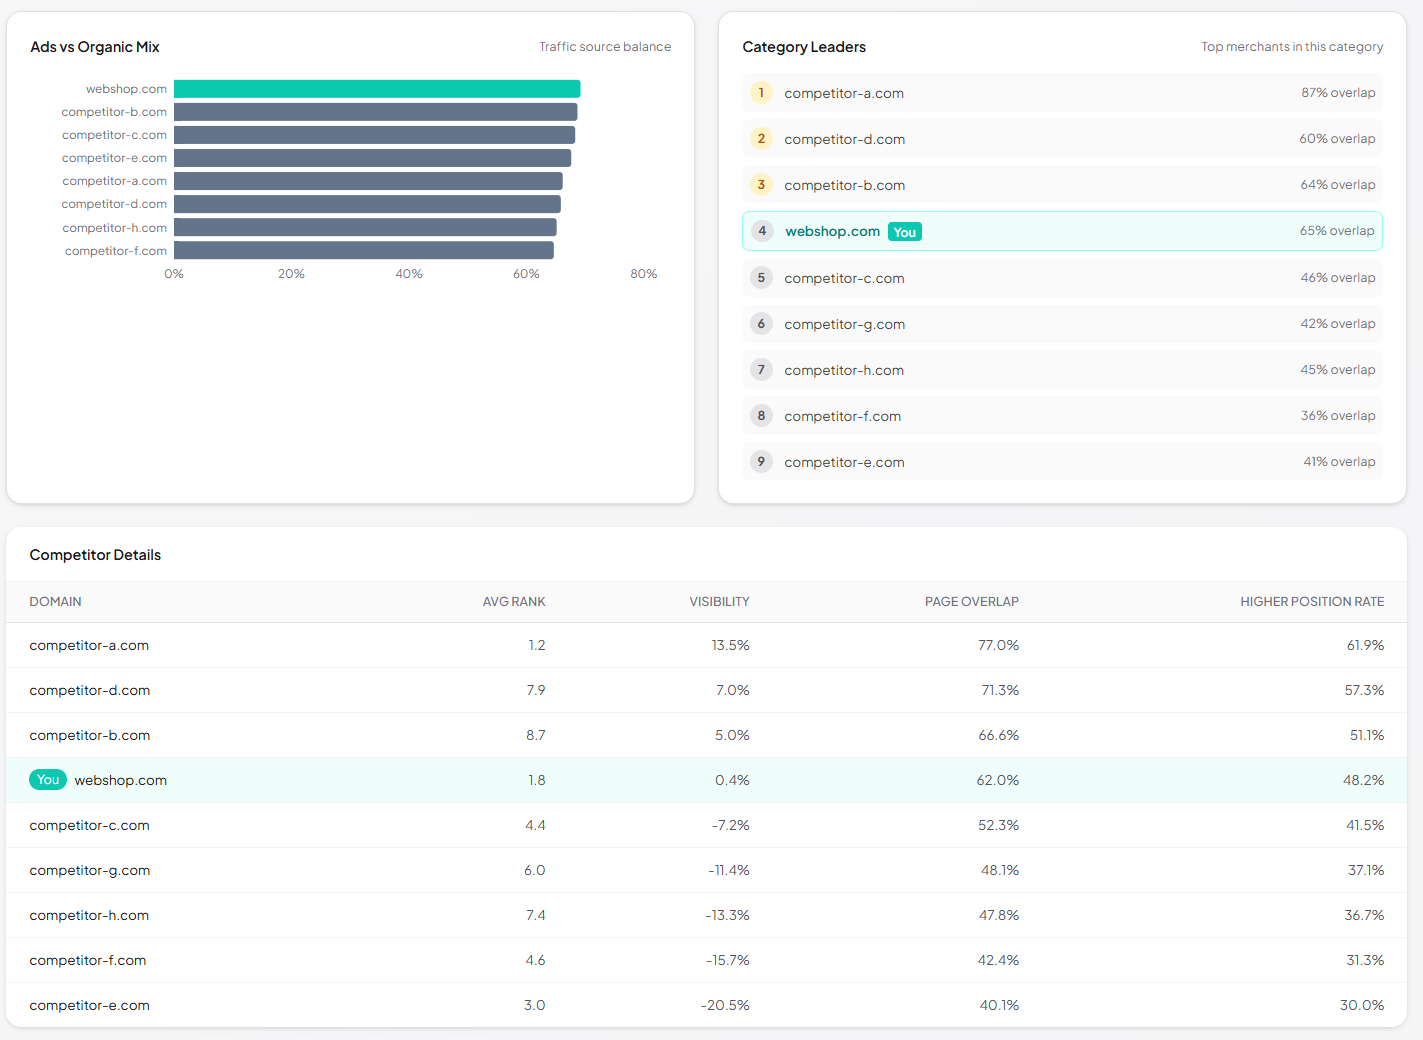
Category leaders board ranking the top merchants in each of your categories, with your own domain highlighted.
-
✓
Competitor details table — every domain with average rank, relative visibility, page-overlap rate, and how often they outrank you.
-
✓
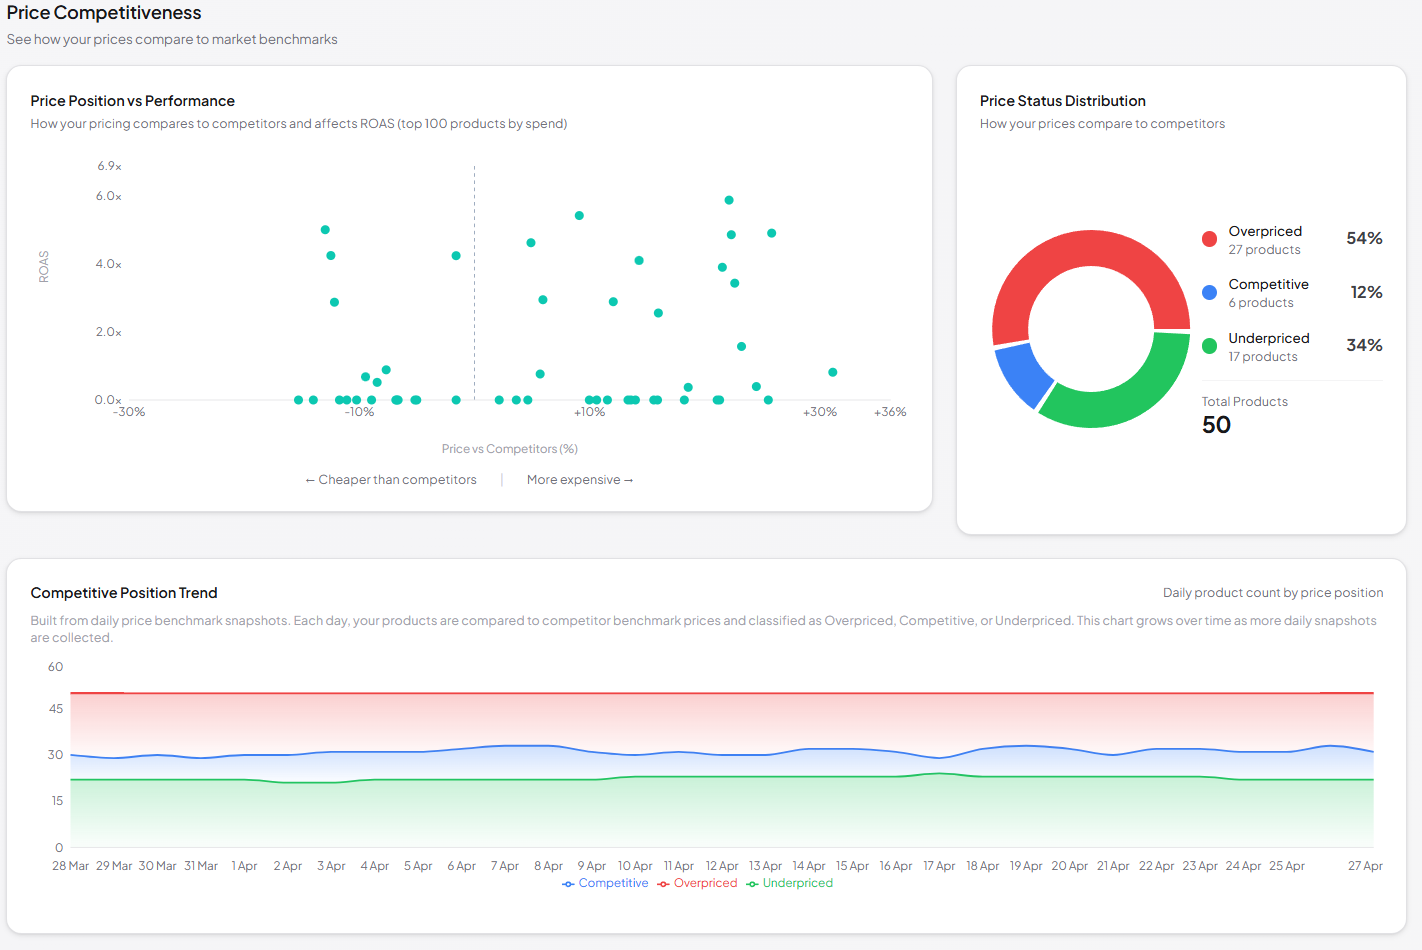
Price-position vs ROAS scatter — every product mapped by price gap vs market benchmark and ROAS, bubble size = spend. Spot overpriced products that still profit, or cheap ones burning budget.
-
✓
Catalog price-position split — donut chart of overpriced / competitive / underpriced products, by both count and total spend.
-
✓
Competitive Position trend over time — how your overall pricing position is shifting day by day.
-
✓
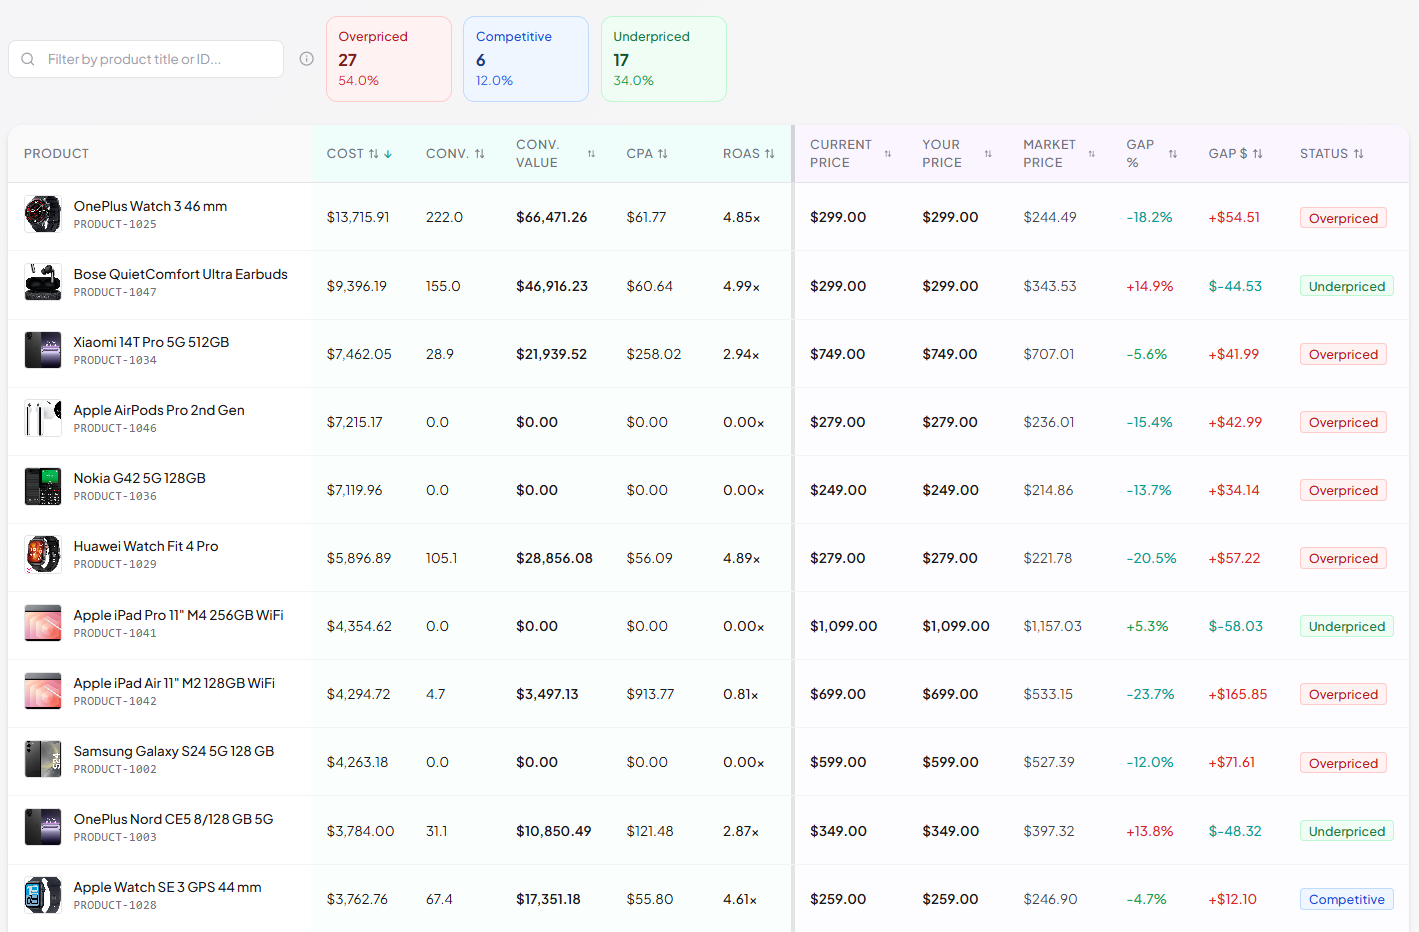
Per-product price comparison table — your price vs Google's benchmark, gap % and currency, status badge, plus full ad performance (cost / conversions / revenue / CPA / ROAS) side by side.
Related reading
How Google's price and visibility benchmarks work underneath.
- Visibility & Competition Google Price Benchmarks Reading Google's benchmark price data and what it actually compares. Read the guide →
- Shopping Analytics Price Competitiveness Spotting overpriced SKUs and deciding what to do about them. Read the guide →
- Visibility & Competition Shopping Auction Insights Who you are up against in the auction, and how to read the overlap. Read the guide →
- Merchant Center Product Taxonomy Updates 2026 Visibility is scored per category — keep your feed mapped correctly. Read the guide →