Portfolio Analytics — Cross-Filter Google Shopping by Brand, Type & Labels
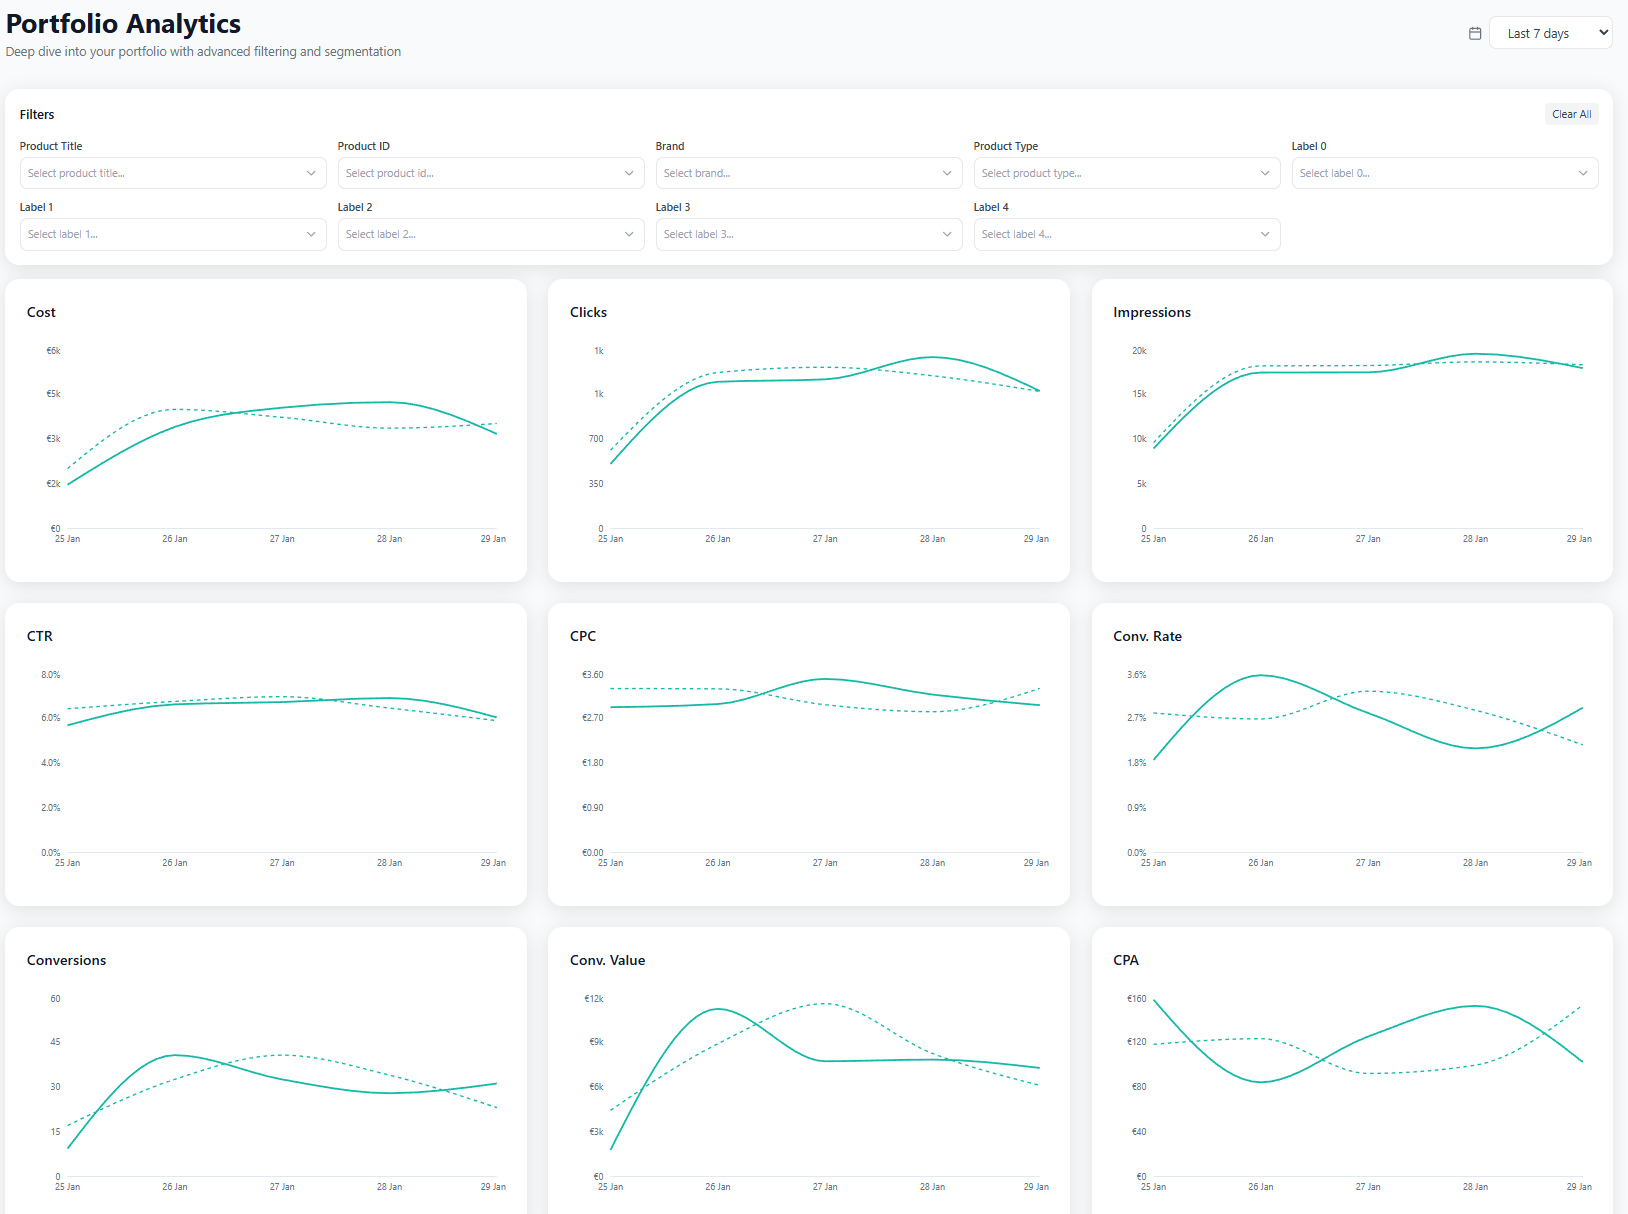
Filter by any combination of brand, product type, and custom labels. Ten synchronized time series charts update in real-time, showing exactly how each segment of your catalog performs over time.
No signup required to explore the demo
Multi-Dimensional Filters for Any Product Segment
Filter dropdowns for brand, product type, and all five custom label fields sit at the top of the page. Select one or more values from any filter, and the entire page recalculates. Charts, KPIs, and tables all reflect your filtered segment in real-time.
Google Ads segments by campaign, not by product attribute. If you want to see how "Nike running shoes with custom_label_0 = bestseller" performed last month, you'd normally need a custom report and a spreadsheet. Portfolio Analytics gets you that answer in two clicks.
Open the filter dropdowns at the top of the page, select the values you want, and watch all 10 charts redraw instantly. Combine multiple filters for precise segmentation.
- Brand, product type, and all 5 custom label filters
- Multi-select within each filter dimension
- AND logic across filter dimensions
- Instant recalculation across all charts and KPIs

Cross-Filtering That Google Ads and Looker Can't Do
Google Ads reports by campaign. Looker reports by whatever dimensions your data team configured weeks ago. Neither lets a marketer slice product performance by feed attributes on the fly. Portfolio Analytics does. Pick any brand, product type, or custom label value from a dropdown, and every chart on the page recalculates for that exact product segment.
The filters stack. Select "Nike" in brand, "Running Shoes" in product type, and "High Margin" in custom_label_0, and you get time series charts showing cost, revenue, ROAS, CPA, conversions, clicks, impressions, CTR, CPC, and conversion rate for just that intersection. Try getting that from a Google Ads report without exporting to a spreadsheet.
Every filter dimension comes straight from your Merchant Center feed. You're working with the same product taxonomy you already maintain. No need to build custom reports, tag products differently, or restructure campaigns to get the analysis you need.
- Brand, product type, and all 5 custom label fields as filter dimensions
- AND logic across dimensions, OR within each dimension
- 15 synchronized time series charts update instantly on filter change
- No exports, no spreadsheets, no waiting for data team
See Exactly Which Products Are in Your Segment
Below the charts, a full product table shows every SKU that matches your current filters. Each row has the product image, title, intelligence label, and 15 performance columns: cost, clicks, impressions, CTR, CPC, conversion rate, conversions, revenue, CPA, ROAS, impression share, top impression share, and click share. Sort by any column to rank the products within your filtered segment.
This is where cross-filtering turns into action. The charts tell you that your high-margin Nike segment has a dropping ROAS. The table tells you which specific products are causing it. Sort by CPA descending and you'll find the SKUs that are burning budget. Sort by ROAS and you'll find the ones worth scaling.
A search bar within the table lets you narrow down further by title or product ID. The product count updates in real-time as you filter, so you always know how many SKUs are in your current view.
- Full product table filtered to your active segment
- 15 sortable metric columns including impression share and click share
- Product intelligence labels show each SKU's classification
- Go from segment trends to specific SKU actions in one scroll

Frequently Asked Questions
Why can't I get this analysis from Google Ads or Looker?
Google Ads reports by campaign, not by product feed attributes. You can't ask it "show me ROAS for all Nike products with custom_label_0 = high-margin" without exporting and filtering manually. Looker can do it if someone built the right report, but changing a dimension means waiting for a developer. Portfolio Analytics gives marketers direct access to cross-filter by any feed attribute, instantly.
What filter dimensions are available?
Brand, product type, product title, product ID, and all five custom label fields (custom_label_0 through custom_label_4). Each supports multi-select. Filters combine with AND logic across dimensions, so you can build precise product segments without any export or spreadsheet work.
How many charts update when I change a filter?
All 15 time series charts recalculate simultaneously. Each one shows a different metric (cost, revenue, ROAS, CPA, conversions, clicks, impressions, CTR, CPC, conversion rate, impression share, top impression share, click share) with current vs. previous period comparison. The product table below also filters to show only matching SKUs.
Can I compare two different product segments?
Yes. Set your filters for one segment, note the chart values, then swap a filter value. For example, compare "Nike Running Shoes" against "Adidas Running Shoes" by changing the brand dropdown. Each filter change instantly refreshes all charts and the product table.
Analyze your catalog by any dimension
Explore Portfolio Analytics with sample data, or apply for early access to connect your own account.