
Performance Max channel breakdown is the single most important diagnostic for any ecommerce advertiser running PMax. It tells you exactly where Google is spending your money: Shopping, Search, Display, YouTube, Gmail, Discover, or Maps. Without this data, you are flying blind on a campaign type that touches every Google surface simultaneously.
The good news: Google recently added a "Channel performance" view to the Insights tab in Google Ads, so PMax is no longer a complete black box. The bad news: that view shows impressions and results but not spend per channel, which is the metric that actually matters for budget optimization. For the complete picture — including how much money goes to each network — you still need the Google Ads API or a tool that pulls the data for you.
This guide covers what changed in the Google Ads UI, what a healthy performance max channel breakdown looks like for ecommerce, the three ways to access your data, and what to do when the split looks wrong.
What Changed: Google Adds Channel Data to the Insights Tab
For the first few years of Performance Max, channel-level data was genuinely hidden. The Google Ads UI showed campaign totals, asset group performance, and listing group reports, but nothing about how spend was distributed across networks. The official PMax documentation focused on conversions and steered advertisers away from channel-level thinking.
That changed. Google now shows a "Channel performance" Sankey diagram in the Insights tab, under "Where and when ads showed." This visualization breaks down your PMax campaign by channel — Shopping, Search, Display, YouTube, Gmail, Discover, and Maps — showing impressions, clicks, and results for each.
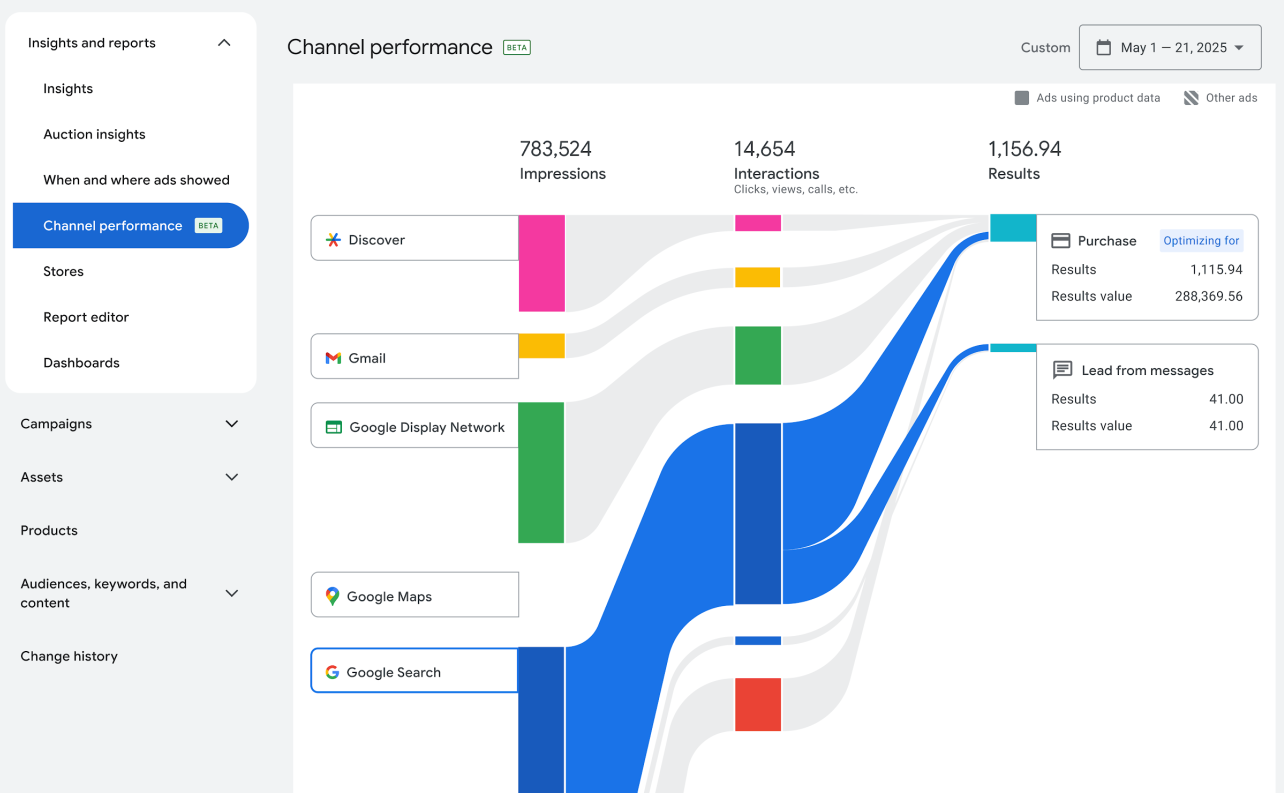
This is a meaningful improvement. For the first time, you can see directly in the UI which channels are getting the most impressions and where results are coming from. But there are real limitations:
- No spend column. The Sankey diagram shows impressions, clicks, and results — but not how much money went to each channel. Spend is the metric that matters most for budget optimization, and it is still missing from this view.
- Sankey format, not a table. The flow visualization looks interesting but is hard to use for practical analysis. You cannot easily compare channels side-by-side or export the data to a spreadsheet.
- Hard to track over time. The Insights tab shows a snapshot for a selected date range, but there is no built-in trend view showing how your channel distribution has shifted week over week. Spotting gradual shifts — like Display creeping from 15% to 30% over a month — requires checking manually each week.
- No asset group-level split. The channel breakdown is at the campaign level. If you have multiple asset groups with different configurations, you cannot see which asset group is driving Display or YouTube spend from this view.
The bottom line: the Insights tab is a useful first check. If you just need a quick glance at which channels PMax is using, it works. But for ongoing monitoring, trend analysis, and budget optimization, you need a more complete performance max channel breakdown that includes spend data. That means either the Google Ads API or a third-party tool that pulls the API data for you.
What a Healthy Performance Max Channel Breakdown Looks Like
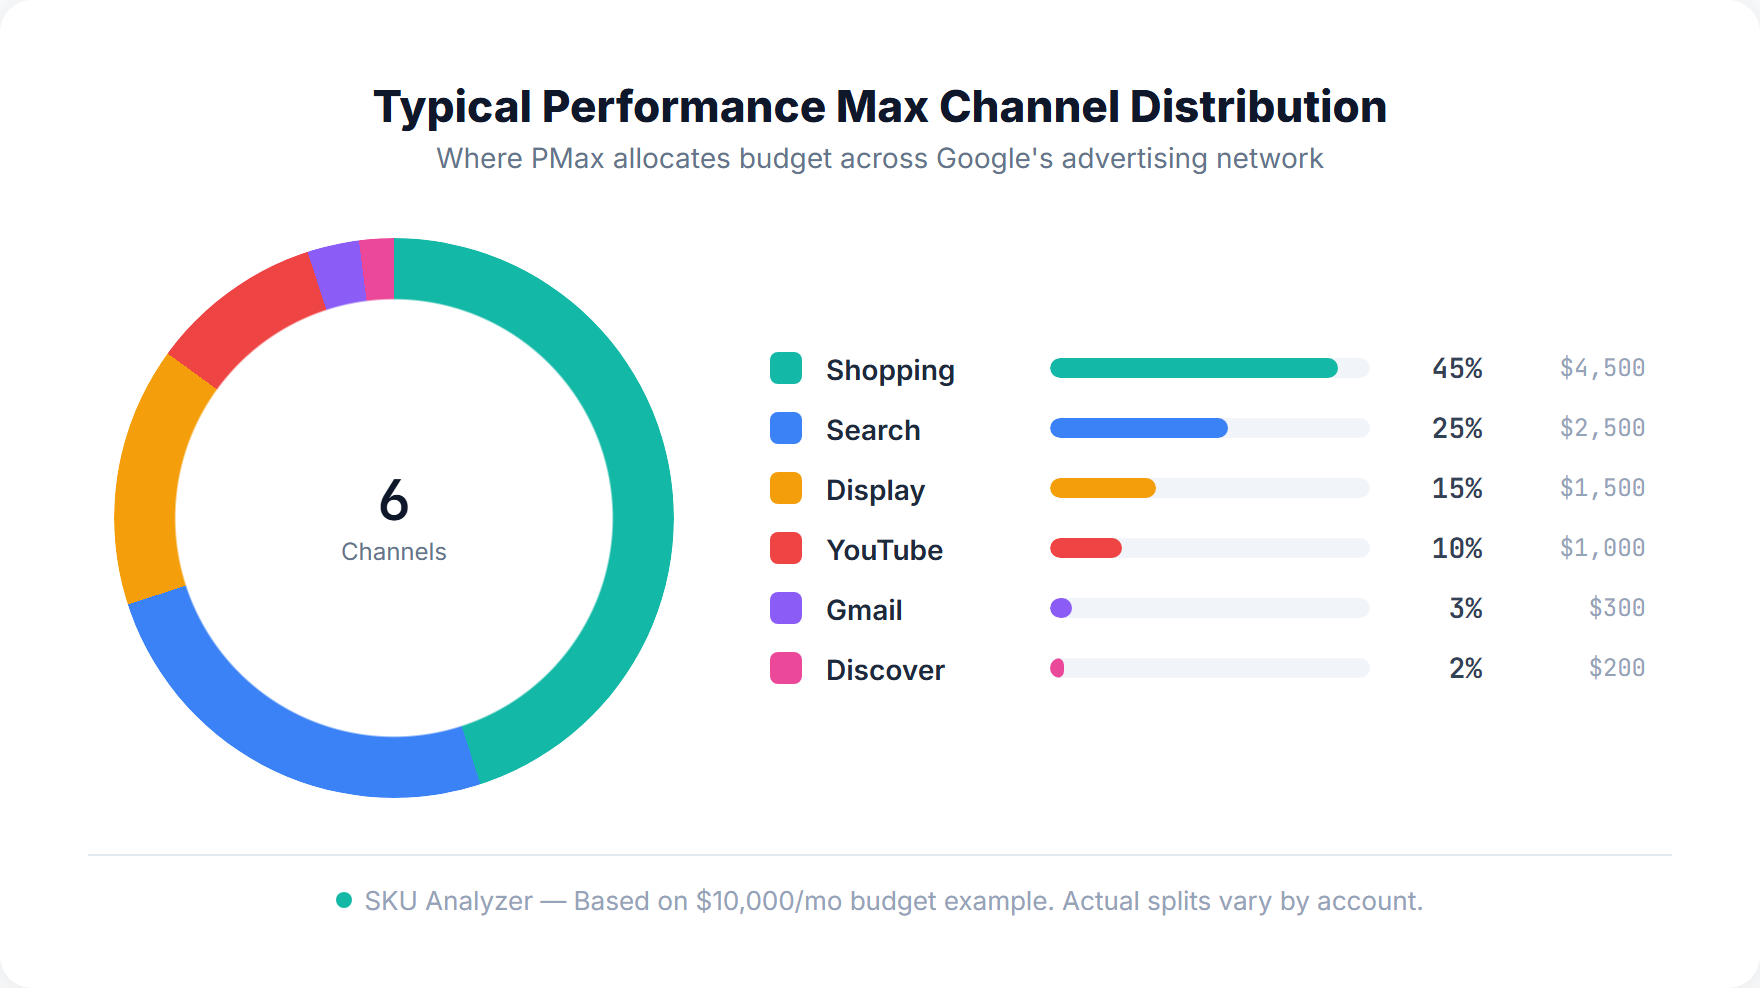
For ecommerce accounts with a product feed, the ideal performance max channel breakdown concentrates spend on Shopping and Search — the channels where users are actively searching for and comparing products. A healthy split for a typical ecommerce PMax campaign looks roughly like this:
- Shopping: 60-80%. This is where the money should go. Shopping placements capture high-intent traffic from people who are ready to compare and buy. If your feed is healthy and your bids are competitive, Shopping should dominate your channel breakdown.
- Search: 10-20%. Text-based ads on Google Search. PMax creates these from your headlines and descriptions (or from your feed data for dynamic search ads). Search captures high-intent queries and converts well, though it may overlap with any standard Search campaigns you are running.
- Display: 5-15%. Banner and responsive ads across the Google Display Network. Some Display spend is normal — PMax uses it for prospecting and remarketing. But Display CPCs are cheap ($0.10-0.50 vs $1-3+ for Shopping), which means Google can burn through budget here quickly with low conversion rates.
- YouTube: 3-10%. Video ads before, during, or alongside YouTube content. Lower conversion rates than Shopping or Search, but can drive awareness. If you have not provided video assets, PMax may auto-generate basic videos from your images.
- Gmail, Discover, Maps: 1-5% combined. These are minor channels for most ecommerce accounts. Gmail shows ads in the Promotions tab. Discover places products in the personalized feed. Maps is relevant only for retailers with physical stores.
To put real numbers behind this, here is what a single day's performance max channel breakdown might look like for an ecommerce account spending $500/day:
| Network | Spend | Clicks | Conversions | ROAS |
|---|---|---|---|---|
| Shopping | $312.40 | 487 | 14.2 | 6.8x |
| Search | $87.60 | 112 | 3.8 | 4.1x |
| Display | $64.20 | 1,240 | 1.1 | 1.2x |
| YouTube | $28.90 | 890 | 0.4 | 0.9x |
| Gmail + Discover | $6.90 | 58 | 0.2 | 1.5x |
In this example, Shopping takes 62% of spend and drives 72% of conversions at the best ROAS. Display and YouTube together consume 19% but deliver only 8% of conversions. That is a healthy distribution. The key ratio to watch is Shopping + Search as a percentage of total spend — here it is 80%, which is excellent. You can track these daily numbers over time with campaign-level analytics.
Three Ways to Access Your Performance Max Channel Breakdown
There are three methods to get your channel-level data, each with different trade-offs between ease of use and completeness.
Method 1: Google Ads Insights Tab (Free, Limited)
Open your PMax campaign in Google Ads, go to the Insights tab, and look for the "Where and when ads showed" section. The Channel performance Sankey diagram shows impressions, clicks, and results by network. This is the fastest way to get a rough sense of your channel distribution.
Pros: Free, no setup required, built into Google Ads.
Cons: No spend data per channel, Sankey format is hard to compare, no time-series trends, no asset group-level breakdown. You can see where ads showed but not how much you paid for each channel.
Method 2: Google Ads API (Complete, Technical)
The API gives you the full picture. Query the campaign resource with segments.ad_network_type to get spend, clicks, impressions, conversions, and revenue broken down by channel per day. Here is the GAQL query:
SELECT
  campaign.name,
  segments.ad_network_type,
  segments.date,
  metrics.cost_micros,
  metrics.clicks,
  metrics.impressions,
  metrics.conversions,
  metrics.conversions_value
FROM campaign
WHERE campaign.advertising_channel_type = 'PERFORMANCE_MAX'
  AND segments.date DURING LAST_30_DAYS
The segments.ad_network_type field returns values like SEARCH, CONTENT (which covers Display), YOUTUBE_WATCH, YOUTUBE_SEARCH, and others. By aggregating cost by network type, you get a complete performance max channel breakdown with actual spend figures.
Pros: Complete data including spend per channel, daily granularity, can be automated.
Cons: Requires API access and technical skills. You can use Google Ads scripts to export to Google Sheets, or build a custom integration with a supported client library. Looker Studio connectors can also pull this data for custom dashboards.
Method 3: Third-Party Tools (Complete, No Setup)
Tools like the SKU Analyzer PMax Analyzer pull the API data automatically and present it as donut charts, stacked area trends, and asset group performance tables. You connect your Google Ads account and the channel breakdown is ready immediately — no queries, no scripts, no Looker Studio setup.
Pros: Full spend data, visual trends over time, asset group-level breakdown, no technical setup.
Cons: Requires a third-party tool subscription.
For most ecommerce advertisers, the practical choice is either Method 1 for a quick check or Method 3 for ongoing monitoring. The API route (Method 2) makes sense if you already have a data pipeline or engineering resources. Understanding the differences between Shopping and PMax helps frame why this channel-level visibility matters so much.
When Your Performance Max Channel Split Looks Wrong
You have pulled the data and the numbers are off. Maybe Display is eating 30%+ of your budget with a 1.0x ROAS. Maybe YouTube is taking 20% but barely converting. Here is how to diagnose and fix the most common problems.
Display Eating 30%+ of Spend
This is the most common red flag in ecommerce PMax campaigns. Display CPCs are cheap, so Google can burn through budget quickly on banner placements that get lots of impressions but few conversions. The fix is straightforward: remove image assets from your asset groups. Without images, PMax cannot serve responsive display ads and Display spend drops dramatically. Give the campaign 7-14 days to rebalance after the change.
If you want maximum control, switch to a feed-only PMax campaign — no headlines, descriptions, images, or videos. This forces 80%+ of spend into Shopping with a small amount going to Search. You lose Display/YouTube awareness, but for most ecommerce accounts the trade-off is worth it.
YouTube Taking Too Much Budget
If YouTube is above 15% with weak conversion rates, remove video assets. PMax can auto-generate basic videos from your images, but these low-quality auto-generated ads get less YouTube distribution than real video assets. Removing your uploaded videos is the fastest way to reduce YouTube's share.
Set a Target ROAS
If you are using Maximize Conversions or Maximize Conversion Value without a target, Google will find the cheapest conversions wherever they exist — which often means cheap Display clicks with view-through attribution. Setting a target ROAS of 400% or higher forces the algorithm to be selective. Higher-ROAS channels like Shopping naturally get more budget because they deliver more conversion value per dollar spent.
Monitor Weekly, Not Daily
Channel distribution fluctuates daily. The algorithm tests different networks and adjusts based on real-time auction dynamics. A single day where Display spikes to 35% does not mean your campaign is broken. Look at weekly trends over 3-4 weeks. If Display or YouTube share has been climbing steadily with declining ROAS, that is a real signal worth acting on. Use PMax channel tracking over time to spot gradual shifts instead of reacting to daily noise.
Frequently Asked Questions
How do I see my performance max channel breakdown?
There are three ways. First, Google now shows a Channel performance Sankey diagram in the Insights tab under "Where and when ads showed" — this shows impressions and results by channel but not spend. Second, you can query the Google Ads API using the campaign resource with segments.ad_network_type to get full spend, clicks, conversions, and revenue per channel. Third, use a tool like SKU Analyzer that pulls the API data and displays it as donut charts and stacked area trends with no technical setup.
What percentage of my performance max channel breakdown should go to Shopping?
For ecommerce accounts with a product feed, Shopping should typically represent 60-80% of total PMax spend. Shopping captures high-intent traffic from users actively searching for and comparing products. If Shopping is below 50%, your PMax campaign is likely over-investing in awareness channels like Display and YouTube. Running a feed-only PMax campaign (no image or video assets) can push Shopping to 80-95% of spend.
Can I control which channels Performance Max uses in my channel breakdown?
You cannot directly exclude networks from a PMax campaign. But you can influence channel distribution through your asset configuration. Removing image assets reduces Display spend. Removing video assets reduces YouTube spend. Running a feed-only PMax campaign with no creative assets concentrates budget on Shopping and Search. Setting a target ROAS also forces the algorithm to favor higher-converting channels like Shopping over cheaper but lower-converting Display clicks.
Does Google Ads now show performance max channel breakdown data?
Yes, partially. Google added a Channel performance view in the Insights tab that shows a Sankey diagram breaking down impressions, clicks, and results by channel (Shopping, Search, Display, YouTube, Gmail, Discover, Maps). However, it does not show spend per channel, which is the most important metric for budget optimization. For complete channel-level spend data, you still need the Google Ads API or a third-party tool.
How often should I review my performance max channel breakdown?
Review your channel split weekly during the first month after launching or making major changes to a PMax campaign, then bi-weekly once the distribution stabilizes. Do not react to single-day fluctuations — the algorithm tests channels daily and short-term spikes are normal. Focus on weekly trends. If Display or YouTube share has been climbing steadily over three to four weeks with declining ROAS, that is a signal to take action.