
A large share of most Google Shopping budgets goes to products that never convert. They collect clicks, consume budget, and return nothing — and because account-level ROAS looks acceptable, the leak rarely shows up until someone goes looking for it product by product.
Account audits routinely find 20-40% of Shopping spend sitting on products with zero conversions. On a $10,000/month budget that is $2,000-$4,000. This guide covers how to find those products, how to tell genuine waste apart from spend that is simply too recent to have converted yet, and what to do about each case. If product-level analytics is new to you, the Google Shopping analytics guide sets the foundation.
What Counts as Wasted Ad Spend?
Wasted ad spend in Google Shopping is money spent on products that generate clicks but produce zero conversions.
Wasted Spend = Cost on Products with Zero Conversions
If a product has spent $500 over 60 days and generated 0 sales, that $500 is wasted spend.
Five causes account for most of it:
- Uncompetitive pricing. Your price sits above the benchmark, so shoppers click to compare and buy elsewhere. Competition and pricing analytics shows where you stand.
- Irrelevant queries. The product is being triggered by searches that were never going to buy it.
- Poor listings. Weak titles, low-quality images, or missing attributes.
- Landing page friction. Slow pages, broken mobile experience, checkout drop-off.
- No demand. Some products simply do not sell online.
The problem compounds quietly. A product wasting $5/day is $150/month and $1,800/year. Across dozens of non-converting products, that is a serious budget leak that never announces itself.
How Much Are You Actually Wasting?
Most advertisers do not know their number. They see overall ROAS and assume things are fine, but aggregate metrics hide product-level problems. Measuring profit on ad spend (POAS) instead of ROAS usually reveals more, since a product that converts but loses money after costs is still draining budget.
To estimate it: export product performance for the last 30-60 days, filter for Cost > 0 and Conversions = 0, sum the cost column, and divide by total spend. If those products show $3,200 against $12,000 of total spend, the waste rate is 26.7%.
| Waste Level | Percentage | Interpretation |
|---|---|---|
| Excellent | < 10% | Well-optimized account with active management |
| Average | 10-25% | Room for improvement; typical for most accounts |
| High | 25-40% | Significant optimization opportunity |
| Critical | > 40% | Urgent action needed; likely unmanaged account |
How to See Which Products Are Wasting Budget
The data is already in your account. In Google Ads, open your Shopping campaign, click Products in the left sidebar, set the date range to at least 30 days (60-90 is better), then filter for Conversions = 0 and Cost > 0 and sort by cost descending. The products at the top are your biggest drains.
That works, and for a small catalogue it may be all you need. It breaks down as the catalogue grows: the export is a point-in-time snapshot with no history, so you cannot see whether waste is climbing or falling; there are no alerts; and it carries none of your Merchant Center context, so the pricing and feed data you need to diagnose the cause sits in a different tool.
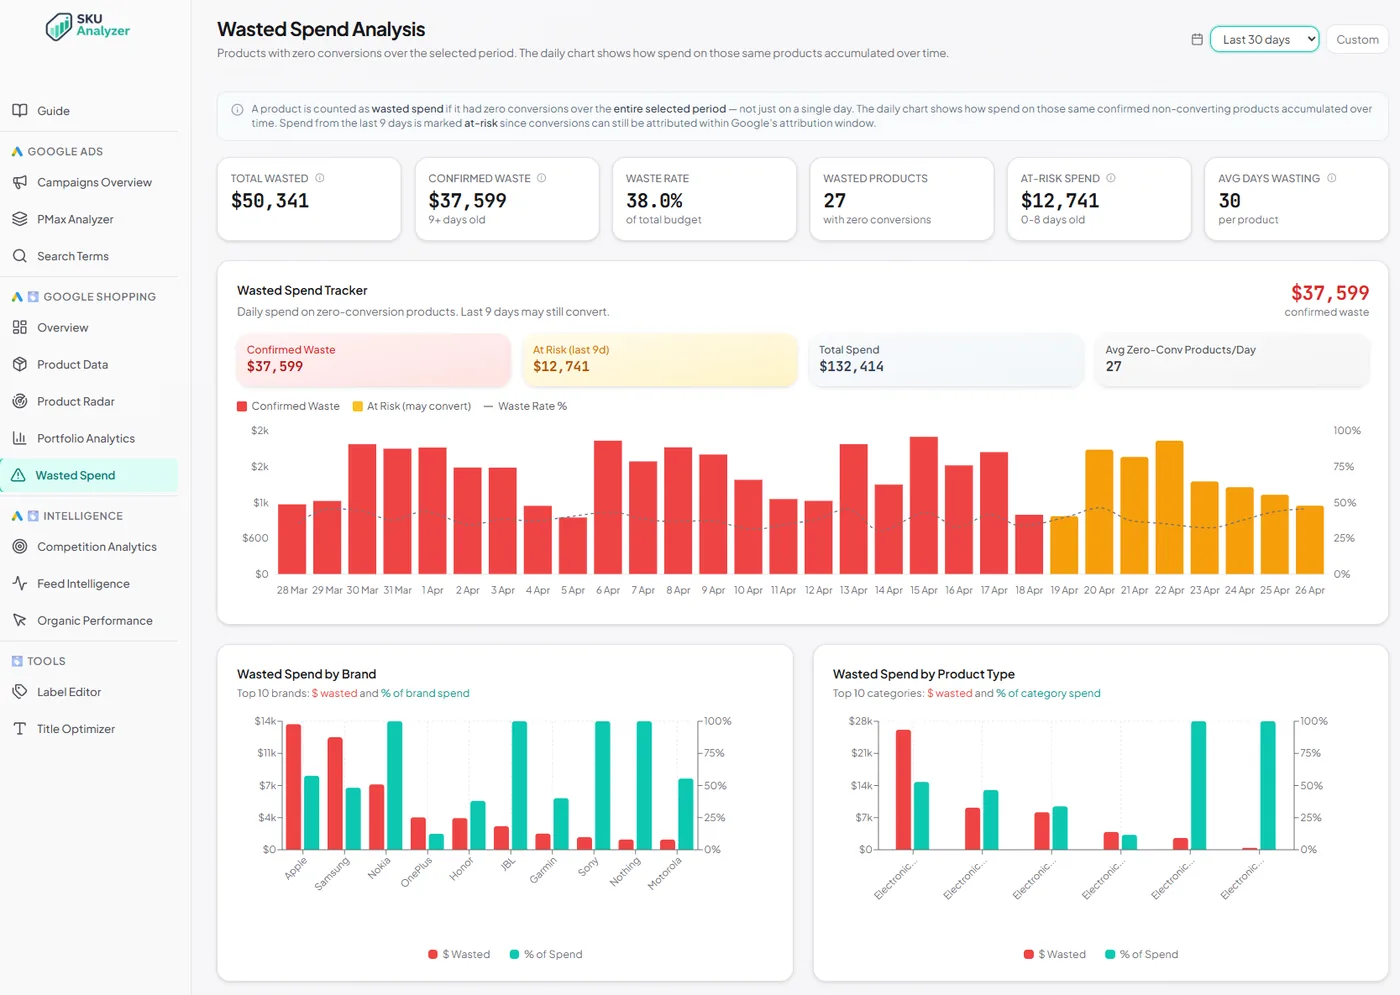
Where you see a dashboard in this guide, it is SKU Analyzer, which keeps this calculation running against your Google Ads and Merchant Center data instead of rebuilding it from exports — but the concepts apply whatever tool you use to track them. The headline numbers are the ones worth watching: waste rate as a share of total budget, how many products are involved, and how long each has been wasting.
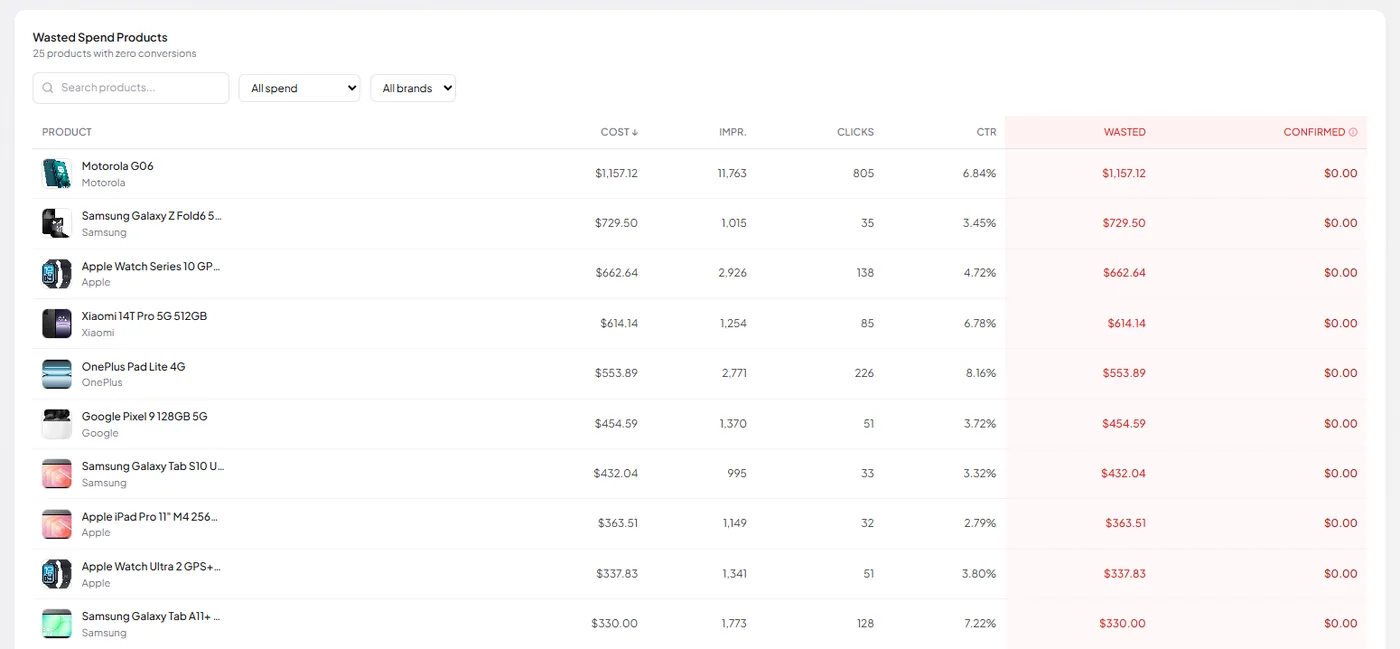
Underneath sits the same filtered list you would have built by hand, already sorted by cost, with the Merchant Center image and brand attached to each row so you can see what you are actually looking at.
Not All Zero-Conversion Spend Is Waste
This is where most premature pauses happen. A product with no conversions in the last week is not a failing product — Google can take 7-30 days to attribute a conversion, so recent spend has not had the chance to prove itself yet. Judge it too early and you pause products that were about to work.
The distinction worth making is between confirmed waste (old enough that conversions would have landed by now) and at-risk spend (still inside the attribution window). Only the first is actionable.
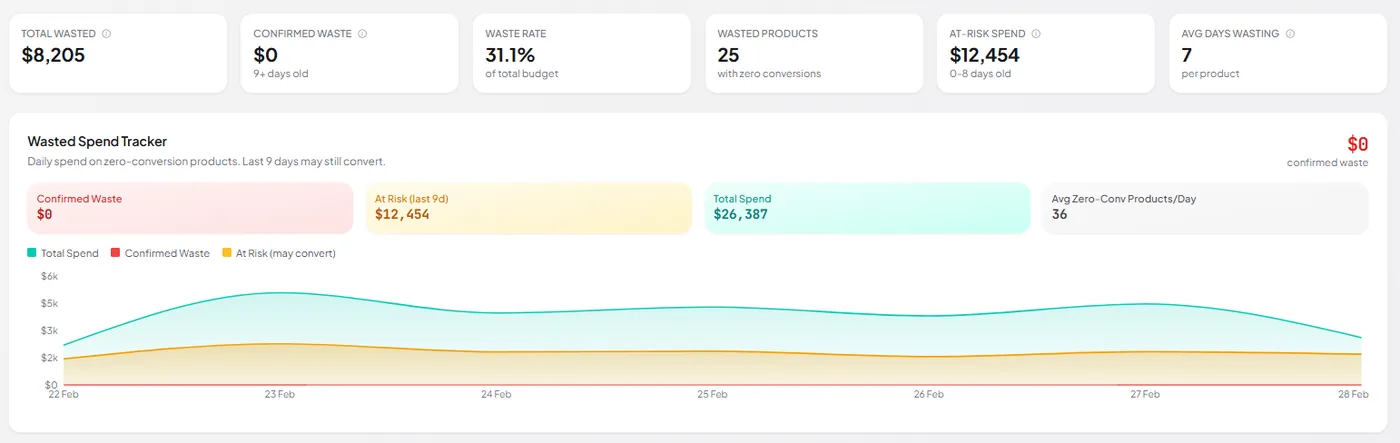
The screenshot above is the argument against short date ranges, in one picture. Over seven days the tracker reports a 31.1% waste rate and $12,454 on products with no conversions, yet confirmed waste is $0 — not one of those days is old enough to judge. Acting on that report would mean pausing products purely for being recent.
Beyond timing, a few zero-conversion products are doing legitimate work: newly added items still accumulating data, seasonal products out of season, high-consideration items with long purchase cycles, and products that assist discovery even when the customer buys something else. And a product with zero impressions is a different problem entirely — see products not getting impressions.
Before judging any product, check it has cleared a reasonable volume bar:
| Product volume | Minimum before judging |
|---|---|
| High (10+ clicks/day) | 14–21 days, 200+ clicks |
| Medium (2–10 clicks/day) | 30 days, 100+ clicks |
| Low (<2 clicks/day) | 60–90 days, 50+ clicks minimum |
Below those thresholds you do not have a failing product, you have an unproven one.
Diagnose Which Stage Is Broken
“Underperforming” describes four different failures with four different fixes, and the metric pairing tells you which one you have:
| Symptom | Stage | Likely cause |
|---|---|---|
| Low impressions | Visibility | Bids, feed quality, disapprovals |
| Impressions, low CTR | Ad appeal | Image, price, title |
| Clicks, no conversions | Post-click | Landing page, checkout, price shock |
| Conversions, poor ROAS | Economics | High CPCs, thin margins |
The two middle rows are the ones that matter for waste, and splitting your zero-conversion products by CTR separates them directly. High CTR with no conversions means the ad is working and something after the click is not — landing page, price, or checkout. Low CTR with no conversions means the listing never earned the click in the first place, which points at the image, title, or price on the ad itself.
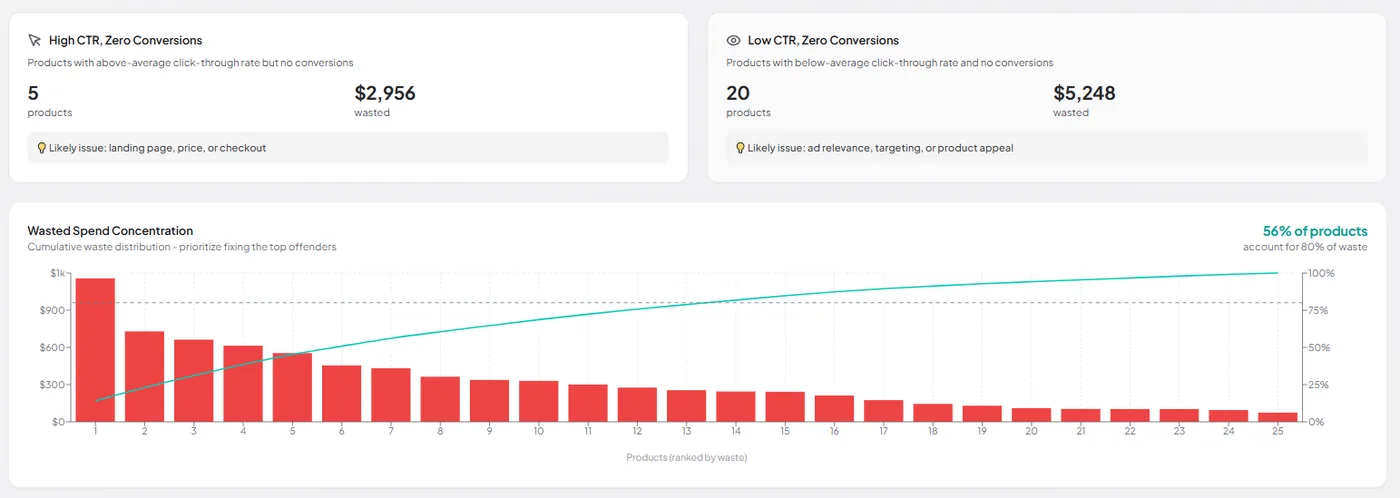
The concentration curve matters just as much as the diagnosis. Waste is rarely spread evenly — in the example above, 56% of the zero-conversion products account for 80% of the wasted spend. Fixing the top handful is worth more than working through the tail, so rank by waste before you start.
Once you know the stage, the fix follows from it. Check price competitiveness in Merchant Center — sitting 20% above benchmark explains a lot of high-CTR, zero-conversion behaviour, and the pricing strategy guide covers the response. For low CTR, work the listing itself: images, and titles per the product title optimization guide. For post-click failures, test load time, mobile experience, and checkout friction. Often the product is fine and the listing or the price is the problem.
Pause, Optimize, or Leave It Alone
Getting this wrong is expensive in both directions: pausing a product that was about to prove itself costs revenue, and “optimizing” a structurally unviable one burns another month of budget. The spend-to-CPA ratio decides it.
| Criteria | Action |
|---|---|
| Spent > 3× target CPA, 60+ days, 0 conversions | Exclude |
| Spent > 2× target CPA, 30-60 days, 0 conversions | Cut bids, or fix and retest |
| High clicks, 0 conversions, competitive price | Investigate post-click causes |
| Spent < 2× target CPA, or under 30 days | Leave it; keep collecting |
With a $25 target CPA, a product that has spent $75+ over 60 days with nothing to show is a clear exclusion. One that has spent $30 over two weeks needs more time, not a decision.
Two other cases justify pulling the plug: a product still below break-even 30 days after a genuine fix, and structural problems you cannot solve — priced 30%+ above market with no room to move, margins that cannot survive a realistic CPC, or a product that needs explaining to sell.
Pausing is not the same as excluding
A paused product still appears in free listings and keeps its organic visibility. Excluding it from the campaign via inventory filters stops the paid spend without removing the product from Google entirely — usually the better first move.
Cut Waste Without Pausing
Exclusion is not the only lever. Products that cannot justify full bids may still earn their place at lower ones, staying eligible to show while consuming far less budget. The practical approach is a tiered structure: aggressive bids on proven performers, standard bids in the middle, minimal bids on zero-converters you are not ready to cut.
Tiering only scales if the tiers maintain themselves, which is what custom labels are for. Segment the feed by performance tier, margin tier, and priority, then build product groups against those labels so bid changes apply to a segment rather than to individual products. Automating label assignment keeps the segments current as performance shifts, which matters because a product's tier is exactly the thing that changes.
The Other Leak: Search Term Waste
Use Google's search terms insights to identify query themes that consume budget without producing useful demand. Before classifying recent spend as waste, account for conversion lag reporting; standard Google Ads reports can then be used to monitor the affected campaigns and products.
Everything above is product-shaped. The second leak is query-shaped and hides in the search terms report rather than the product table, which is why accounts that have cleaned up their catalogue still bleed budget. Five categories account for most of it:
- Irrelevant queries. Matching gone wrong — a “leather wallet” search triggering a leather jacket listing. Block immediately.
- Too-broad queries. Single words like “shoes” or “dress”: enormous volume, unclear intent, poor conversion rates.
- Competitor brand terms. Someone searching a rival brand rarely converts on yours; they wanted that brand specifically.
- Research-intent queries. “How to”, “what is”, and comparison phrasing signal someone who is not buying today.
- Wrong-attribute queries. Right category, wrong size, colour, or price bracket for what you actually stock.
Turn the worst offenders into negatives via the search terms report, but resist being thorough — over-blocking starves the campaign of the discovery traffic that finds new customers. See negative keywords for Shopping for how far to take it, and note that Performance Max exposes far less query data than Standard Shopping does.
Keep It From Coming Back
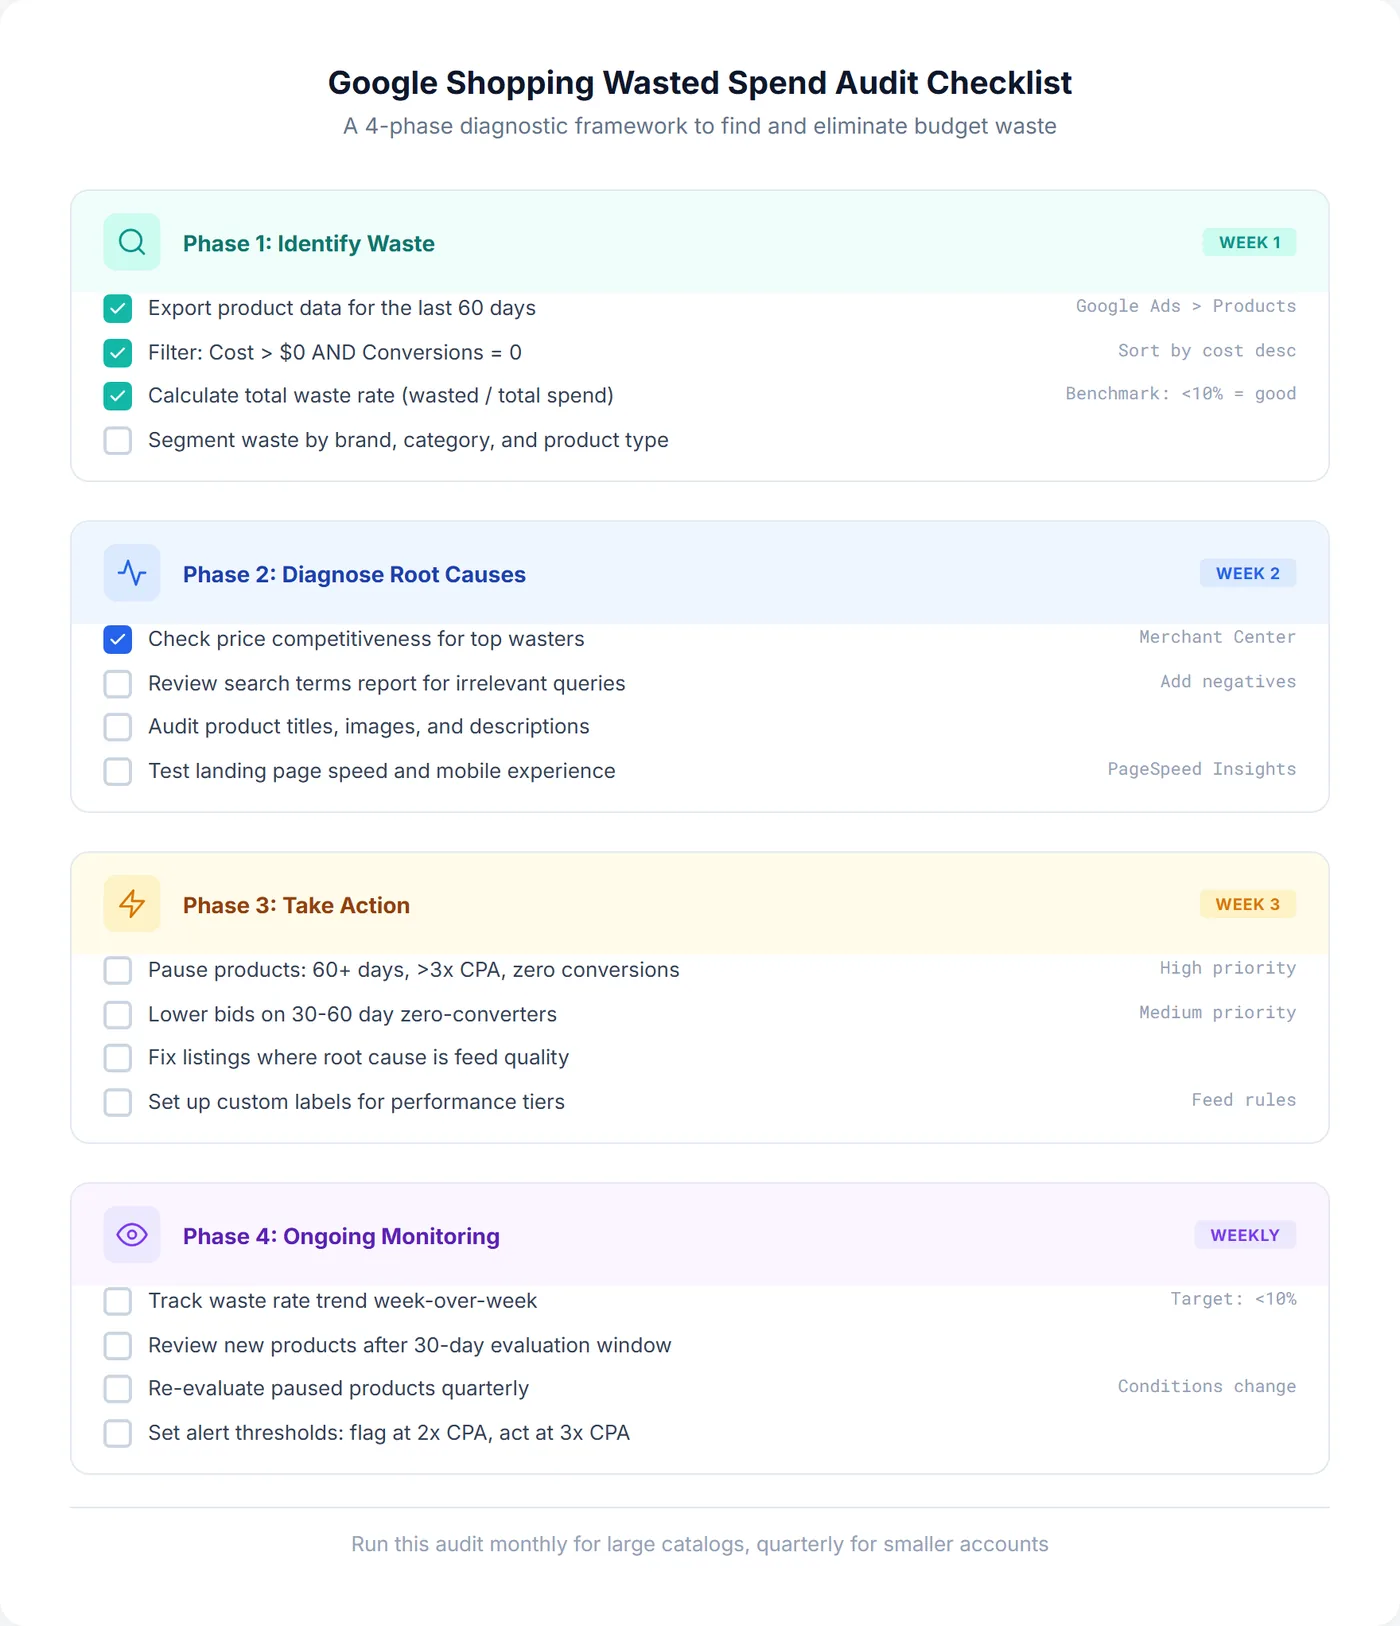
One-time cleanup does not hold. New products get added, competitors reprice, and previously solid products become drains. Make it a weekly pass: review products above your alert threshold, apply the framework above, and track the waste rate week over week — the trend matters more than any single week's number.
Set the thresholds once, against your own economics, so the review is a decision rather than an investigation:
- Flag at 2× target CPA with no conversions.
- Act at 3× target CPA over 30+ days.
- Exclude at 5× target CPA over 60+ days.
Key Takeaway
The goal is not to eliminate every zero-conversion product. It is to catch chronic budget drains systematically while giving new products enough room to prove themselves.
Frequently Asked Questions
How do I see which products are wasting budget in Google Shopping?
In Google Ads, go to your Shopping campaign, click "Products" in the left sidebar, set the date range to 30-60 days, then add filters for Conversions = 0 and Cost > 0. Sort by Cost descending to see your biggest budget drains first. These are products consuming budget without generating any sales.
How do I fix Google Ads wasted spend?
To fix wasted spend: 1) Pause or exclude products that have spent 3x your target CPA with zero conversions over 60+ days, 2) Lower bids on underperforming products instead of pausing them entirely, 3) Check if pricing, images, or landing pages are causing the issue, 4) Add negative keywords to prevent irrelevant search queries, and 5) Use custom labels to segment products by performance tier.
What percentage of Shopping budget is typically wasted?
Studies and account audits typically find that 20-40% of Google Shopping budget goes to products that generate clicks but zero conversions. The exact percentage varies by industry, catalog size, and how actively the account is managed.
Should I pause all products with zero conversions?
Not immediately. Consider how long the product has been running (wait at least 30 days), how much has been spent (set a threshold like 2-3x your target CPA), and whether there's conversion lag. Only pause products that have had sufficient time and spend without converting.
How often should I check for wasted spend?
Review wasted spend weekly as part of your optimization routine. For large catalogs, consider using automated tools that continuously monitor for waste and alert you when products exceed spending thresholds without converting.
What causes products to waste budget without converting?
Common causes include: uncompetitive pricing, poor product images or titles, landing page issues (slow load, bad mobile experience), wrong audience targeting (irrelevant search queries), and products that simply don't have demand online.
What's the difference between pausing and excluding a product?
Pausing a product group stops ads temporarily and can be reversed easily. Excluding a product removes it from a campaign entirely using inventory filters. Use pausing for temporary issues; use exclusions for products you're confident shouldn't advertise.