
"Is 45% impression share good?" It depends. Google's Auction Insights documentation makes the first limitation clear: competitor impression share is calculated only across auctions where your eligibility overlaps. Benchmarks therefore vary by industry, product category, targeting and business goals.
Before looking at benchmarks, remember that impression share measures how often your ads appear relative to how often they could appear. It's a measure of market coverage, not performance. High impression share with poor ROAS isn't a win.
Important Context
These benchmarks are aggregated from industry data and should be used as directional guidance, not absolute targets. Your optimal impression share depends on your margins, competition, and business objectives.
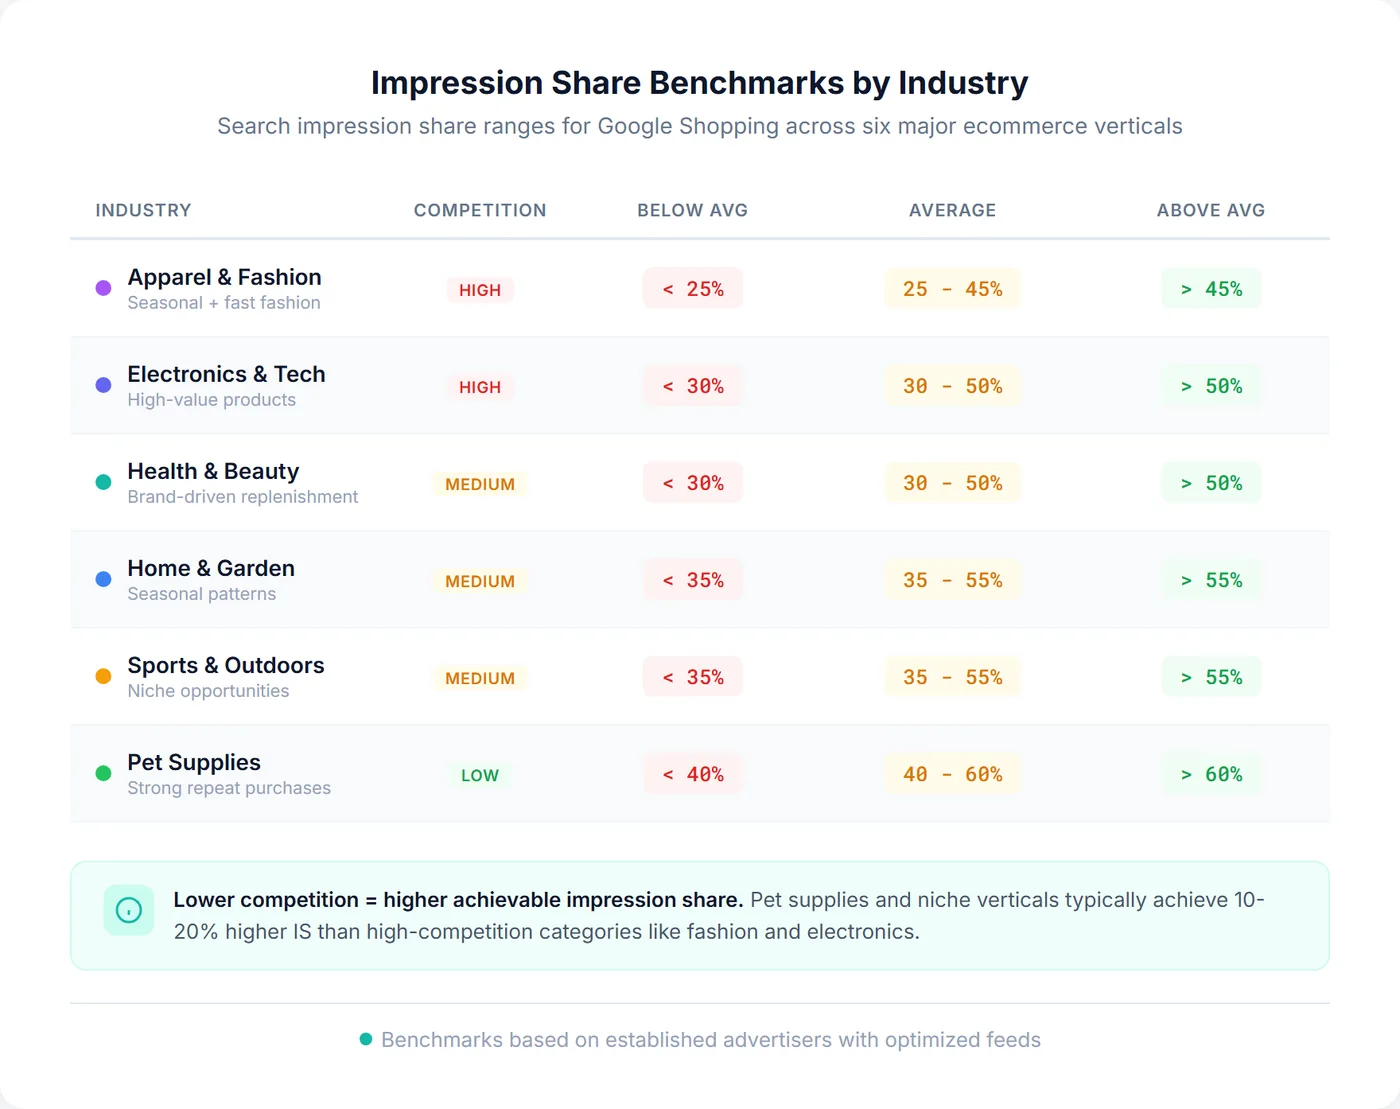
Impression Share Benchmarks by Industry
The following benchmarks represent typical ranges for established advertisers with optimized feeds. New advertisers or those with feed issues may see significantly lower numbers.
Apparel & Fashion
| Metric | Below Average | Average | Above Average |
|---|---|---|---|
| Search Impression Share | < 25% | 25-45% | > 45% |
| Click Share | < 20% | 20-40% | > 40% |
| Top Impression Share | < 15% | 15-35% | > 35% |
Why apparel is competitive: Large number of advertisers, seasonal fluctuations, fast fashion trends, and significant spend from major retailers. Niche apparel (e.g., vintage, sustainable) may see higher impression share. Consider using Performance Max campaigns to expand reach across more surfaces in competitive verticals, and track your competitive visibility by category to see exactly where you stand against other apparel advertisers.
Electronics & Technology
| Metric | Below Average | Average | Above Average |
|---|---|---|---|
| Search Impression Share | < 30% | 30-50% | > 50% |
| Click Share | < 25% | 25-45% | > 45% |
| Top Impression Share | < 20% | 20-40% | > 40% |
Electronics characteristics: High-value products justify higher bids. Competition varies significantly - commodity items (cables, adapters) are highly competitive, while specialized electronics may be less so. Use Google Shopping price benchmarking to understand whether your prices are keeping you competitive in electronics auctions. Tools with product-level analytics can help you correlate impression share with individual SKU performance.
Home & Garden
| Metric | Below Average | Average | Above Average |
|---|---|---|---|
| Search Impression Share | < 35% | 35-55% | > 55% |
| Click Share | < 30% | 30-50% | > 50% |
| Top Impression Share | < 25% | 25-45% | > 45% |
Home & garden opportunity: Generally less competitive than apparel and electronics. Seasonal patterns (spring/summer for garden, fall/winter for home) affect benchmarks. Specialty items often achieve higher impression share.
Health & Beauty
| Metric | Below Average | Average | Above Average |
|---|---|---|---|
| Search Impression Share | < 30% | 30-50% | > 50% |
| Click Share | < 25% | 25-45% | > 45% |
| Top Impression Share | < 20% | 20-40% | > 40% |
Health & beauty dynamics: Highly competitive for popular brands and products. Replenishment products (skincare, vitamins) have different patterns than one-time purchases. Brand matters significantly.
Sports & Outdoors
| Metric | Below Average | Average | Above Average |
|---|---|---|---|
| Search Impression Share | < 35% | 35-55% | > 55% |
| Click Share | < 30% | 30-50% | > 50% |
| Top Impression Share | < 25% | 25-45% | > 45% |
Pet Supplies
| Metric | Below Average | Average | Above Average |
|---|---|---|---|
| Search Impression Share | < 40% | 40-60% | > 60% |
| Click Share | < 35% | 35-55% | > 55% |
| Top Impression Share | < 30% | 30-50% | > 50% |
Pet supplies advantage: Generally lower competition than major retail categories. Strong repeat purchase patterns. Niche pet products (exotic pets, specialty diets) often achieve very high impression share.
Factors That Affect Your Impression Share
Industry benchmarks provide context, but your actual impression share depends on several factors:
1. Budget vs. Market Size
Impression share is fundamentally about how much of the available market your budget can capture. If you're a small player in a large market, lower impression share is expected.
Example
A $5K/month budget competing in women's fashion (huge market) might achieve 10% impression share. The same budget in vintage typewriter accessories (small market) might achieve 80%+. Both could be optimal for their context.
2. Product Price Point
Higher-priced products often have higher impression share because:
- Higher margins support higher bids
- Fewer competitors at premium price points
- Lower search volume means fewer impressions needed
3. Feed Quality
Poor feed quality limits impression share regardless of budget. Common issues:
- Missing or incorrect product titles
- Low-quality images that don't meet Google Shopping image requirements
- Incorrect product categories
- Missing required attributes
4. Price Competitiveness
Products priced significantly above competitors may receive fewer impressions even with competitive bids. Google's algorithm factors in likelihood of conversion, and price competitiveness affects that.
5. Seasonality
Impression share typically drops during peak seasons (Q4 holiday, category-specific peaks) as competition increases. Your 60% impression share in February may become 35% in November. Understanding how Google calculates impression share helps contextualize these seasonal swings.
How to Interpret Your Impression Share
Lost Impression Share Analysis
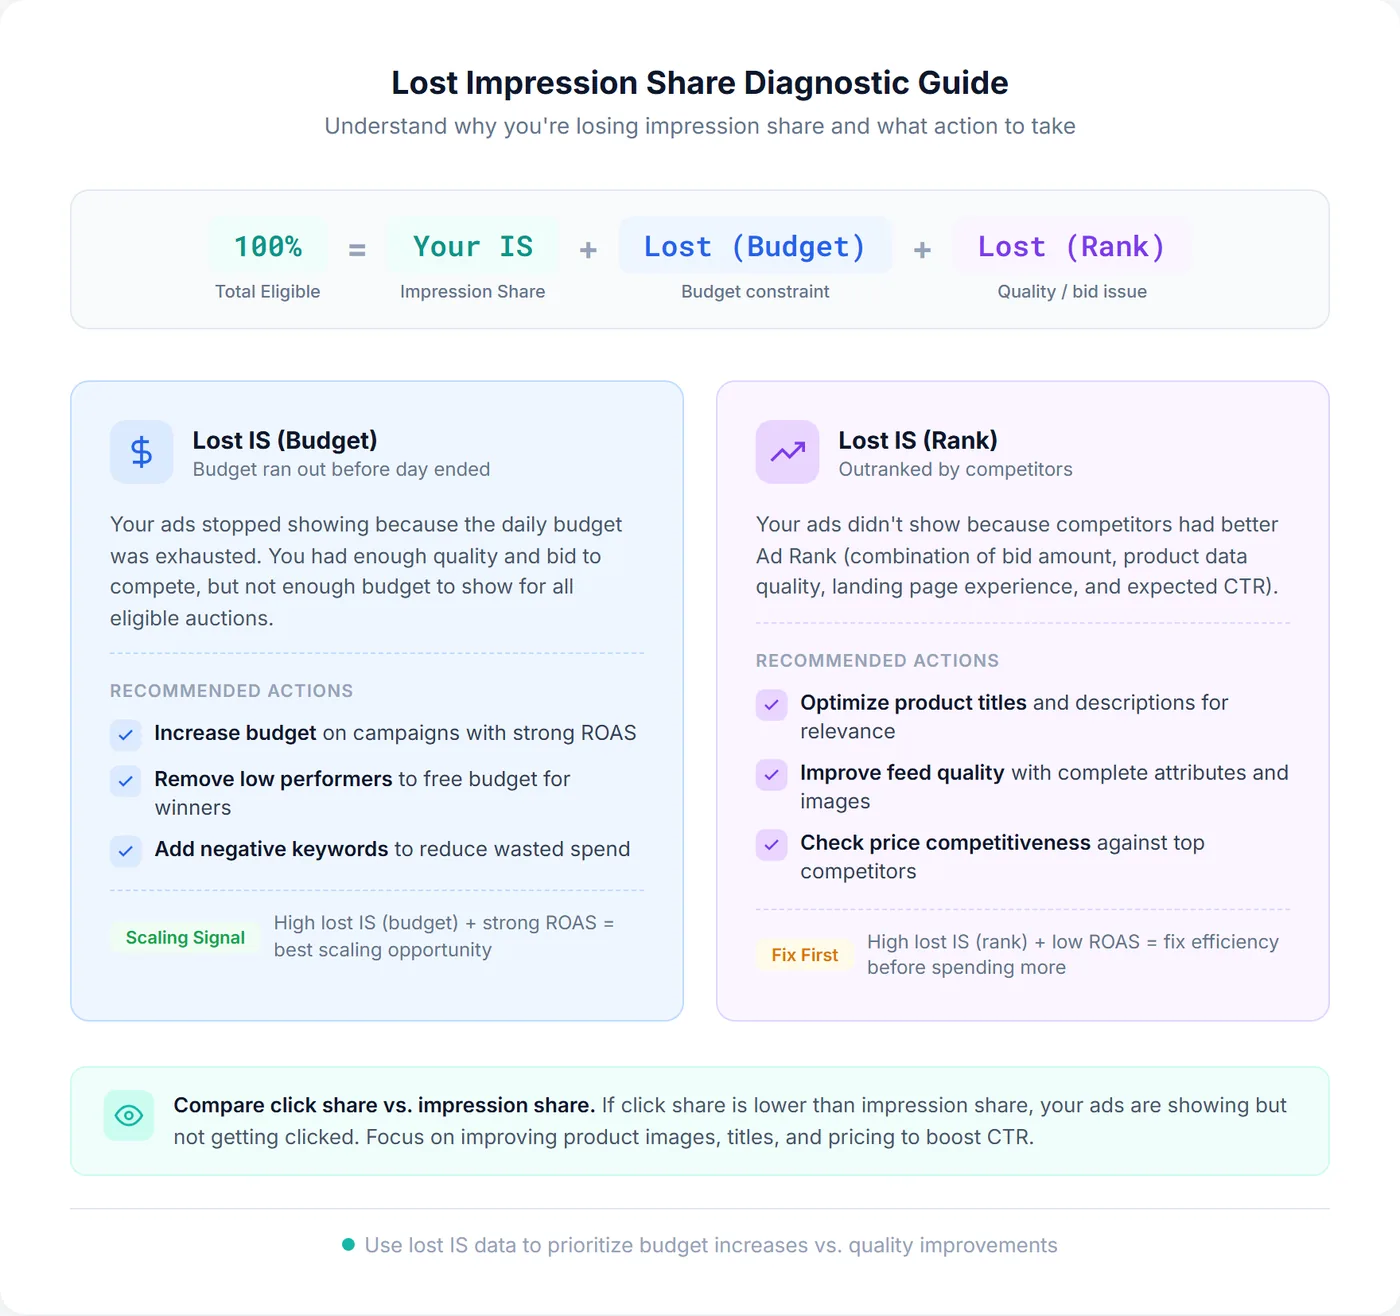
Impression share lost tells you why you're not showing:
| Metric | What It Means | Action |
|---|---|---|
| Lost IS (Budget) | Your budget ran out before all eligible impressions | Increase budget or improve efficiency to afford more |
| Lost IS (Rank) | Competitors outbid you or have better quality | Increase bids or improve feed/landing page quality |
Pro Tip
If you're losing impression share to budget but your ROAS is strong, that's often the best scaling signal. Increase budget on those campaigns. If you're losing to rank with poor ROAS, focus on efficiency before scaling.
Impression Share vs. Click Share
Comparing these metrics reveals ad effectiveness:
- Click share > Impression share: Your ads are compelling - people click more often than average
- Click share < Impression share: Visibility is good but ads aren't compelling - check titles, images, prices
- Click share ≈ Impression share: Performance matches visibility (typical)
What Impression Share Should You Target?
Don't Target 100%
Achieving 100% impression share almost always requires overbidding. At some point, the incremental cost to gain the next percentage point exceeds the value of those impressions. Use the Standard Shopping bid simulator to estimate the cost and impression trade-off before raising bids. High impression share with poor returns is not a win at all, which is the argument for measuring on POAS rather than ROAS once margins vary across the catalog.
Segment Your Targets
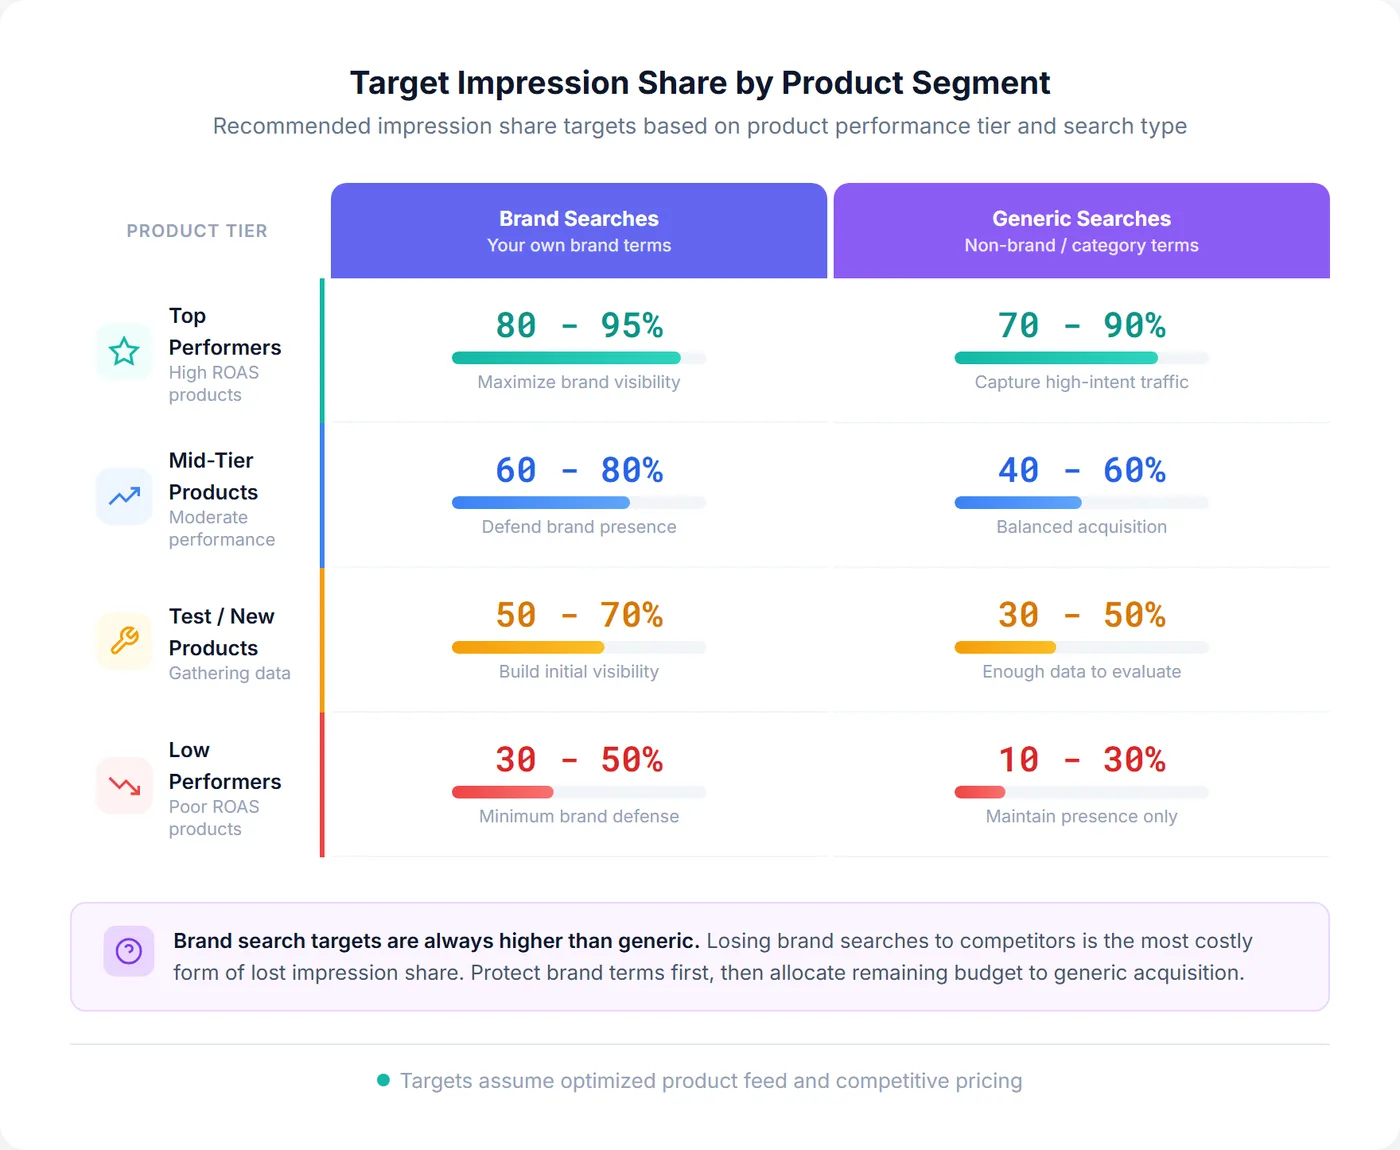
Different products warrant different impression share targets:
| Product Segment | Target IS | Rationale |
|---|---|---|
| Top performers (high ROAS) | 70-90% | Maximize exposure on profitable products |
| Mid-tier products | 40-60% | Balanced exposure and efficiency |
| Test/new products | 30-50% | Enough data to evaluate, not over-investing |
| Low performers | 10-30% | Maintain presence without heavy spend |
Brand vs. Non-Brand
If you sell branded products (your own brand):
- Brand searches: Target 80%+ impression share - these are your customers
- Generic searches: Industry benchmark is fine - acquisition focus
- Competitor brand searches: Evaluate ROI carefully - often low conversion rate
Use auction insights to understand which competitors are capturing impression share in your market.
Tracking Impression Share Over Time
Impression share is more useful as a trend than as a single snapshot. Google's Target Impression Share bidding strategy can help you maintain consistent visibility over time:
- Weekly review: Check for sudden drops that indicate issues
- Monthly comparison: Track against previous month, accounting for seasonality
- Year-over-year: Compare to same period last year for seasonal categories
The practical obstacle is that Google Ads reports impression share against the campaign, while the benchmarks above only mean something once you can see the metric per segment. An account sitting at 22% overall is not one number — it is a handful of products holding 60% and a long tail holding almost nothing, and the account average hides both.
This is what Portfolio Analytics in SKU Analyzer is for. Impression share and top impression share sit in the same KPI grid as cost, ROAS and conversion value, each with its own daily trend line, and the filter row above them re-scopes every tile at once — by brand, by product type, or by any of the five custom labels. Filter to one brand and you are reading that brand's impression share against the benchmark, not the account's.
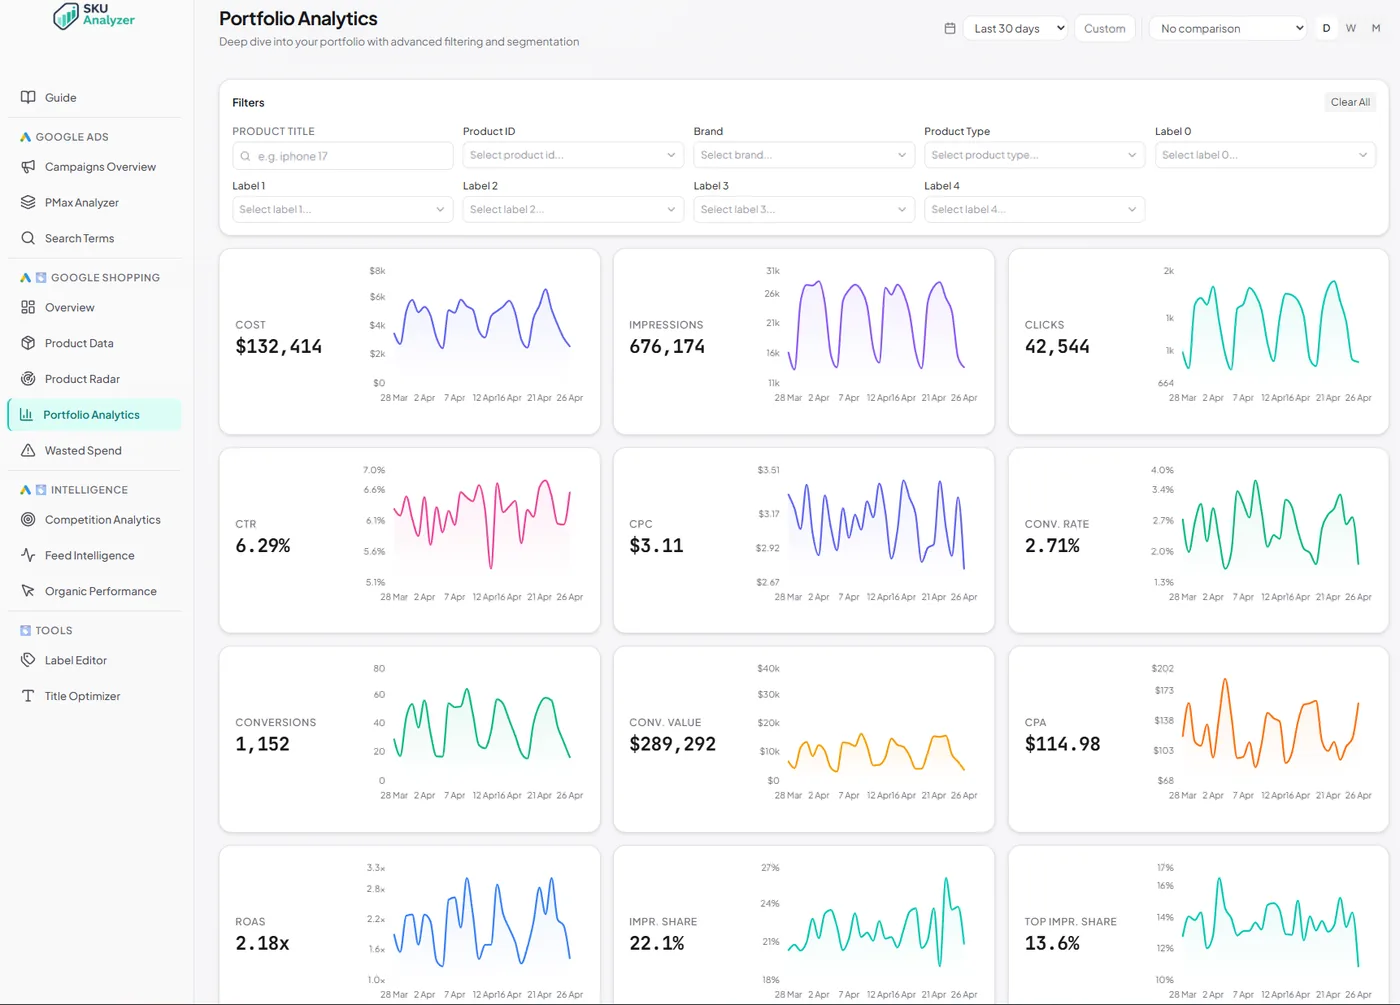
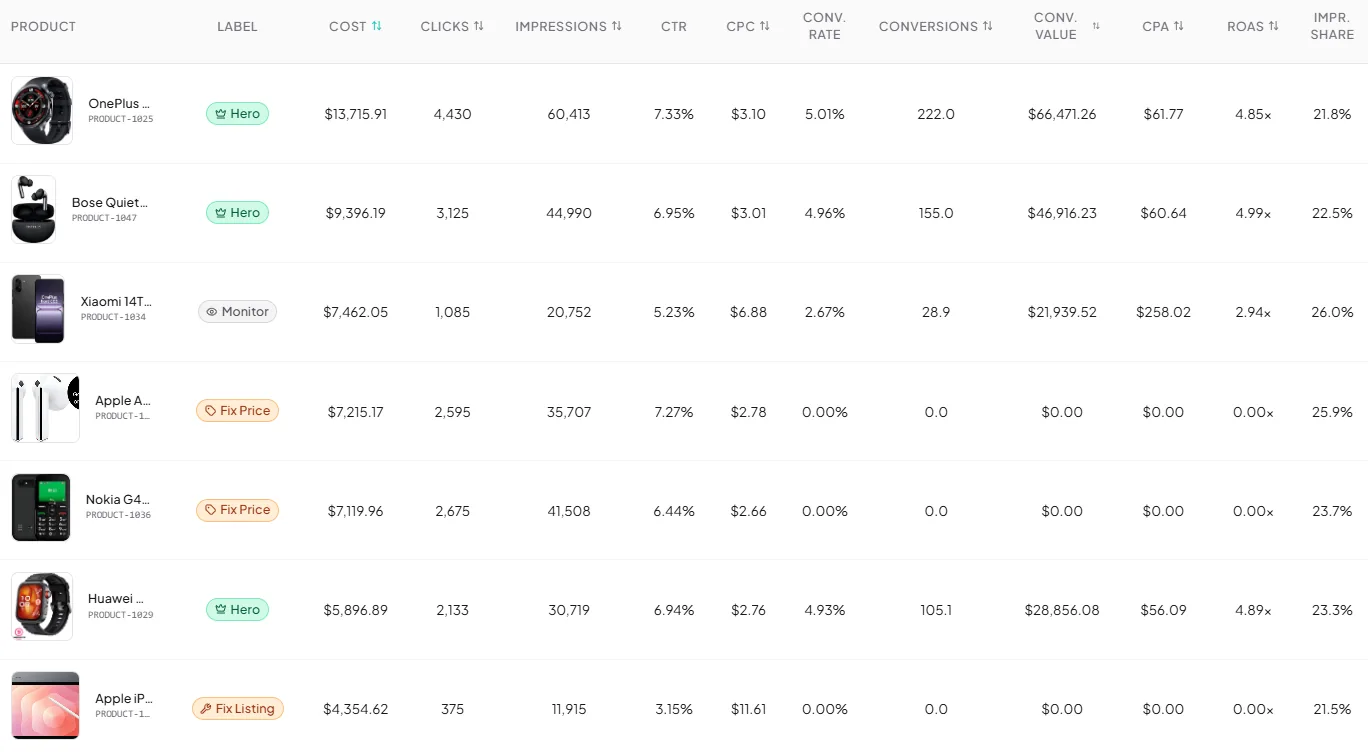
One level deeper, the same page lists impression share per product next to spend, conversions and ROAS. That pairing is what makes the number actionable: a product at 26% impression share with strong ROAS is an obvious place to bid up, while a product at 26% with no conversions is not a visibility problem at all. The labels in the table — Hero, Monitor, Fix Price, Fix Listing — are assigned by rules you define, so the segments you set targets for above are the segments you can actually filter and measure.
Warning Sign
A sudden drop in impression share (more than 15-20% in a week) without a corresponding budget change usually indicates a problem - feed issues, policy violations, or significant competitive changes. See the feed update recovery guide to investigate promptly.
Frequently Asked Questions
What is a good impression share for Google Shopping?
A "good" impression share varies by industry, but generally: 60-80% is excellent for most verticals, 40-60% is average, and below 30% suggests significant opportunity or issues. For brand terms, aim for 80%+. For generic/competitive terms, 30-50% may be realistic.
Should I aim for 100% impression share?
Rarely. Achieving 100% impression share usually requires overbidding, which often isn't profitable. The optimal impression share is where incremental cost equals incremental value. For most advertisers, 60-80% on top products is more profitable than 100% everywhere.
Why is my impression share different for each product?
Impression share varies by product based on: bid competitiveness, product data quality, price competitiveness, search volume for that product type, and how many competitors sell the same or similar items. Products with less competition will naturally have higher impression share.
How do I improve impression share without increasing budget?
Focus on efficiency improvements: optimize product titles and images, ensure competitive pricing, improve feed quality scores, analyze search terms to find and eliminate hidden budget waste, and segment campaigns to allocate budget to higher-performing products.